Salvadoran vs Spanish Median Female Earnings
COMPARE
Salvadoran
Spanish
Median Female Earnings
Median Female Earnings Comparison
Salvadorans
Spanish
$37,083
MEDIAN FEMALE EARNINGS
0.4/ 100
METRIC RATING
264th/ 347
METRIC RANK
$38,098
MEDIAN FEMALE EARNINGS
3.5/ 100
METRIC RATING
241st/ 347
METRIC RANK
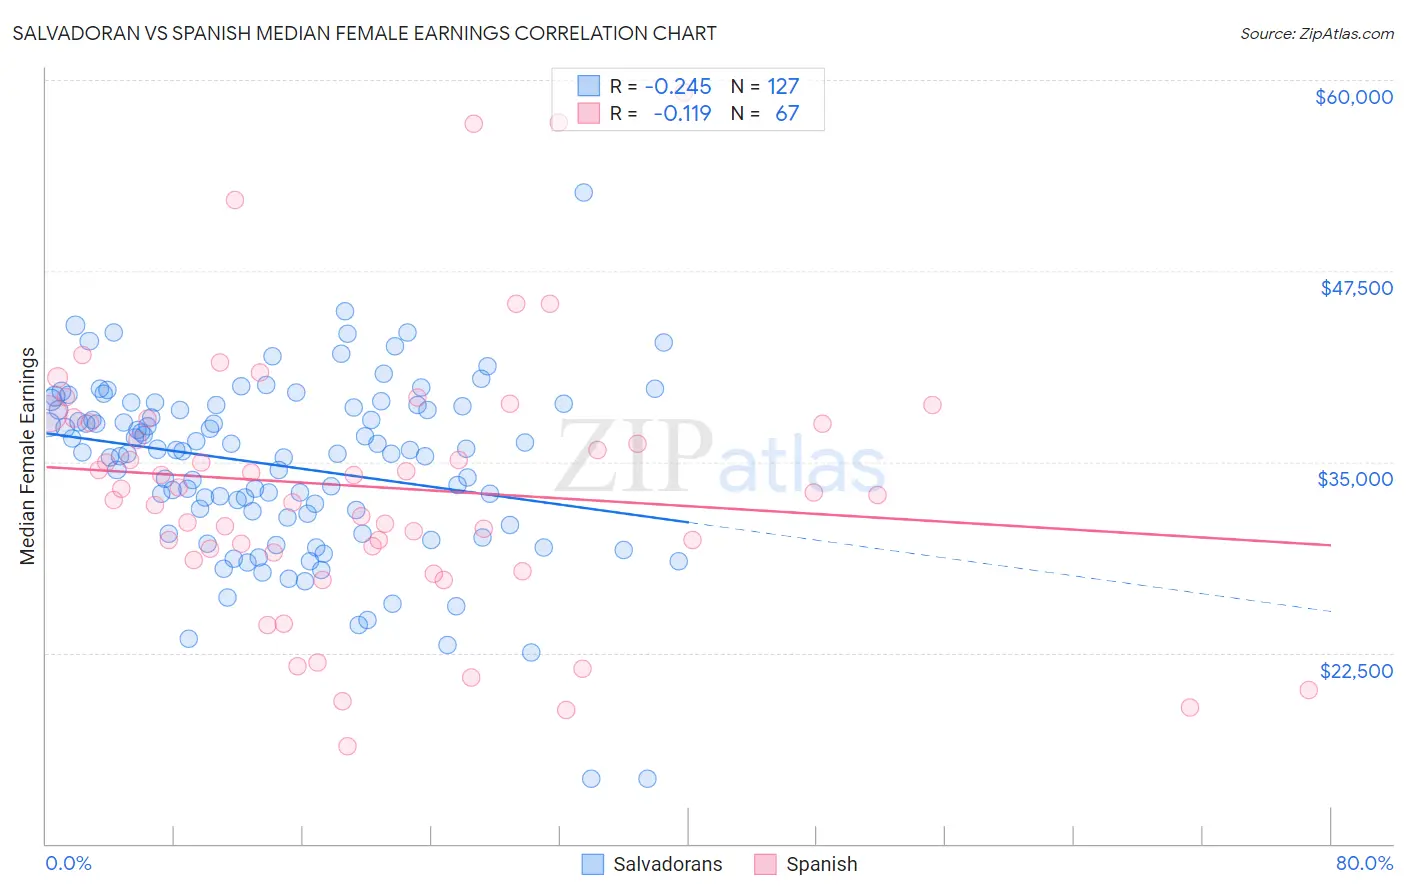
Salvadoran vs Spanish Median Female Earnings Correlation Chart
The statistical analysis conducted on geographies consisting of 398,898,517 people shows a weak negative correlation between the proportion of Salvadorans and median female earnings in the United States with a correlation coefficient (R) of -0.245 and weighted average of $37,083. Similarly, the statistical analysis conducted on geographies consisting of 421,897,645 people shows a poor negative correlation between the proportion of Spanish and median female earnings in the United States with a correlation coefficient (R) of -0.119 and weighted average of $38,098, a difference of 2.7%.
Median Female Earnings Correlation Summary
| Measurement | Salvadoran | Spanish |
| Minimum | $14,245 | $16,357 |
| Maximum | $52,604 | $59,157 |
| Range | $38,359 | $42,800 |
| Mean | $34,711 | $33,351 |
| Median | $35,673 | $33,021 |
| Interquartile 25% (IQ1) | $31,372 | $29,054 |
| Interquartile 75% (IQ3) | $38,695 | $37,790 |
| Interquartile Range (IQR) | $7,323 | $8,737 |
| Standard Deviation (Sample) | $5,811 | $8,760 |
| Standard Deviation (Population) | $5,788 | $8,694 |
Similar Demographics by Median Female Earnings
Demographics Similar to Salvadorans by Median Female Earnings
In terms of median female earnings, the demographic groups most similar to Salvadorans are German Russian ($37,105, a difference of 0.060%), Immigrants from Belize ($37,056, a difference of 0.070%), Dominican ($37,046, a difference of 0.10%), Nonimmigrants ($37,024, a difference of 0.16%), and Cree ($37,018, a difference of 0.18%).
| Demographics | Rating | Rank | Median Female Earnings |
| Hawaiians | 1.0 /100 | #257 | Tragic $37,497 |
| Belizeans | 0.9 /100 | #258 | Tragic $37,429 |
| Scotch-Irish | 0.8 /100 | #259 | Tragic $37,383 |
| Dutch | 0.7 /100 | #260 | Tragic $37,339 |
| Malaysians | 0.7 /100 | #261 | Tragic $37,298 |
| Venezuelans | 0.7 /100 | #262 | Tragic $37,282 |
| German Russians | 0.5 /100 | #263 | Tragic $37,105 |
| Salvadorans | 0.4 /100 | #264 | Tragic $37,083 |
| Immigrants | Belize | 0.4 /100 | #265 | Tragic $37,056 |
| Dominicans | 0.4 /100 | #266 | Tragic $37,046 |
| Immigrants | Nonimmigrants | 0.4 /100 | #267 | Tragic $37,024 |
| Cree | 0.4 /100 | #268 | Tragic $37,018 |
| Immigrants | Venezuela | 0.4 /100 | #269 | Tragic $37,003 |
| French American Indians | 0.3 /100 | #270 | Tragic $36,920 |
| Nicaraguans | 0.3 /100 | #271 | Tragic $36,904 |
Demographics Similar to Spanish by Median Female Earnings
In terms of median female earnings, the demographic groups most similar to Spanish are Immigrants from Burma/Myanmar ($38,028, a difference of 0.18%), Finnish ($38,173, a difference of 0.20%), English ($38,196, a difference of 0.26%), Alaska Native ($38,202, a difference of 0.27%), and Immigrants from Cabo Verde ($38,208, a difference of 0.29%).
| Demographics | Rating | Rank | Median Female Earnings |
| Celtics | 5.0 /100 | #234 | Tragic $38,283 |
| Sudanese | 4.4 /100 | #235 | Tragic $38,215 |
| Liberians | 4.4 /100 | #236 | Tragic $38,215 |
| Immigrants | Cabo Verde | 4.3 /100 | #237 | Tragic $38,208 |
| Alaska Natives | 4.3 /100 | #238 | Tragic $38,202 |
| English | 4.2 /100 | #239 | Tragic $38,196 |
| Finns | 4.0 /100 | #240 | Tragic $38,173 |
| Spanish | 3.5 /100 | #241 | Tragic $38,098 |
| Immigrants | Burma/Myanmar | 3.0 /100 | #242 | Tragic $38,028 |
| Germans | 2.8 /100 | #243 | Tragic $37,986 |
| Immigrants | Liberia | 2.7 /100 | #244 | Tragic $37,970 |
| Immigrants | Middle Africa | 2.7 /100 | #245 | Tragic $37,965 |
| Delaware | 2.6 /100 | #246 | Tragic $37,964 |
| Immigrants | Somalia | 2.4 /100 | #247 | Tragic $37,914 |
| Alaskan Athabascans | 2.3 /100 | #248 | Tragic $37,905 |