Chinese vs Cajun Median Female Earnings
COMPARE
Chinese
Cajun
Median Female Earnings
Median Female Earnings Comparison
Chinese
Cajuns
$41,461
MEDIAN FEMALE EARNINGS
97.5/ 100
METRIC RATING
109th/ 347
METRIC RANK
$34,034
MEDIAN FEMALE EARNINGS
0.0/ 100
METRIC RATING
327th/ 347
METRIC RANK
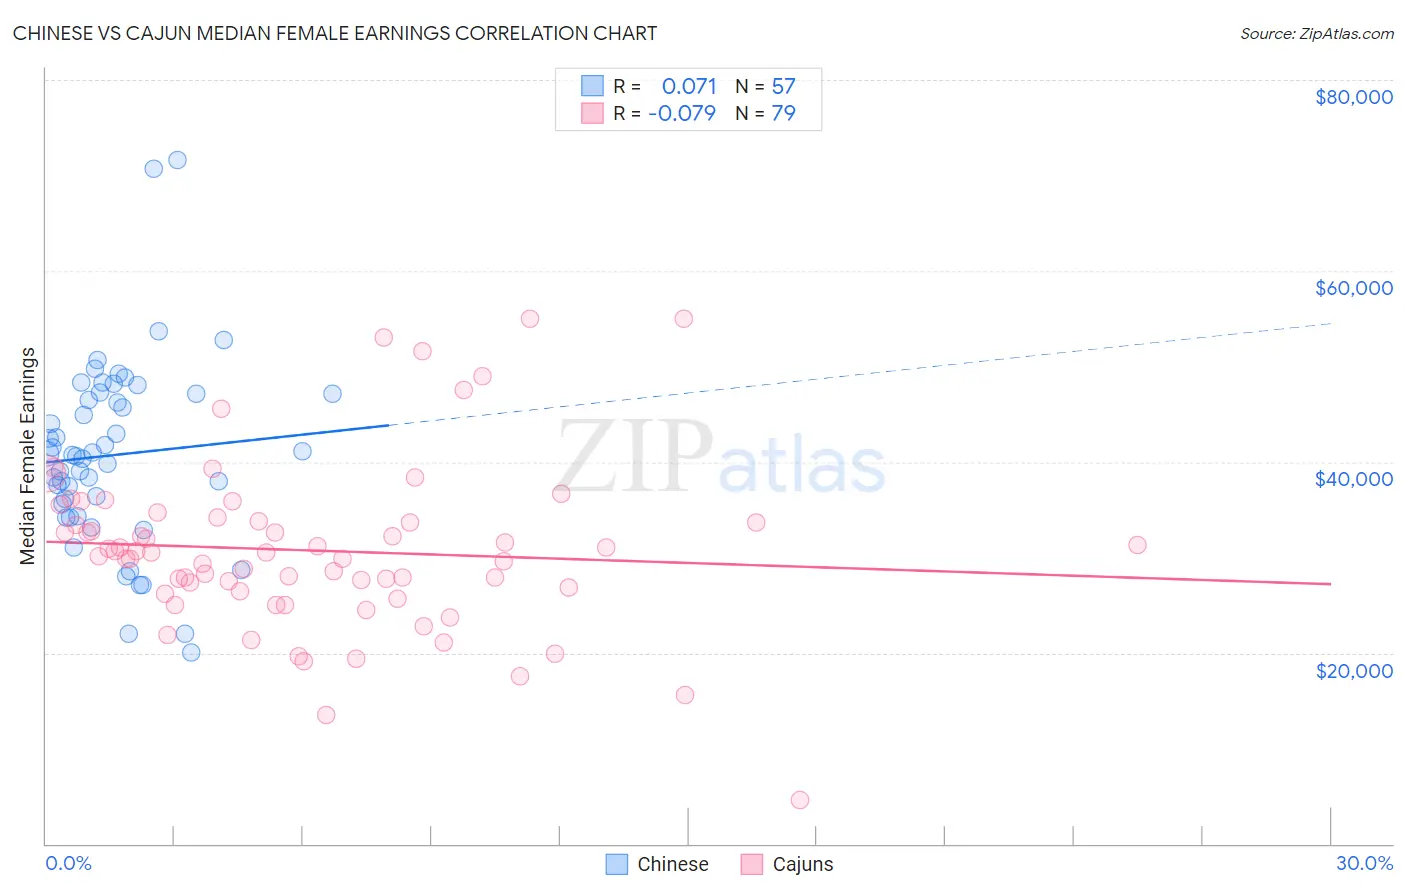
Chinese vs Cajun Median Female Earnings Correlation Chart
The statistical analysis conducted on geographies consisting of 64,808,152 people shows a slight positive correlation between the proportion of Chinese and median female earnings in the United States with a correlation coefficient (R) of 0.071 and weighted average of $41,461. Similarly, the statistical analysis conducted on geographies consisting of 149,646,456 people shows a slight negative correlation between the proportion of Cajuns and median female earnings in the United States with a correlation coefficient (R) of -0.079 and weighted average of $34,034, a difference of 21.8%.
Median Female Earnings Correlation Summary
| Measurement | Chinese | Cajun |
| Minimum | $20,043 | $4,615 |
| Maximum | $71,591 | $55,000 |
| Range | $51,548 | $50,385 |
| Mean | $40,727 | $30,723 |
| Median | $40,673 | $30,456 |
| Interquartile 25% (IQ1) | $34,915 | $26,402 |
| Interquartile 75% (IQ3) | $47,174 | $33,785 |
| Interquartile Range (IQR) | $12,258 | $7,382 |
| Standard Deviation (Sample) | $9,803 | $8,808 |
| Standard Deviation (Population) | $9,716 | $8,752 |
Similar Demographics by Median Female Earnings
Demographics Similar to Chinese by Median Female Earnings
In terms of median female earnings, the demographic groups most similar to Chinese are Jordanian ($41,464, a difference of 0.010%), Palestinian ($41,484, a difference of 0.050%), Immigrants from Eritrea ($41,485, a difference of 0.060%), Italian ($41,505, a difference of 0.10%), and Immigrants from Zimbabwe ($41,527, a difference of 0.16%).
| Demographics | Rating | Rank | Median Female Earnings |
| Immigrants | Poland | 98.2 /100 | #102 | Exceptional $41,630 |
| Immigrants | Argentina | 97.9 /100 | #103 | Exceptional $41,554 |
| Immigrants | Zimbabwe | 97.8 /100 | #104 | Exceptional $41,527 |
| Italians | 97.7 /100 | #105 | Exceptional $41,505 |
| Immigrants | Eritrea | 97.6 /100 | #106 | Exceptional $41,485 |
| Palestinians | 97.6 /100 | #107 | Exceptional $41,484 |
| Jordanians | 97.5 /100 | #108 | Exceptional $41,464 |
| Chinese | 97.5 /100 | #109 | Exceptional $41,461 |
| Immigrants | Western Asia | 97.0 /100 | #110 | Exceptional $41,375 |
| Immigrants | Canada | 97.0 /100 | #111 | Exceptional $41,373 |
| Immigrants | North America | 96.7 /100 | #112 | Exceptional $41,319 |
| Macedonians | 96.4 /100 | #113 | Exceptional $41,286 |
| Immigrants | England | 96.4 /100 | #114 | Exceptional $41,277 |
| Koreans | 96.4 /100 | #115 | Exceptional $41,276 |
| Immigrants | Brazil | 96.4 /100 | #116 | Exceptional $41,273 |
Demographics Similar to Cajuns by Median Female Earnings
In terms of median female earnings, the demographic groups most similar to Cajuns are Kiowa ($34,074, a difference of 0.12%), Dutch West Indian ($34,106, a difference of 0.21%), Immigrants from Central America ($33,953, a difference of 0.24%), Hopi ($33,932, a difference of 0.30%), and Menominee ($33,894, a difference of 0.41%).
| Demographics | Rating | Rank | Median Female Earnings |
| Immigrants | Honduras | 0.0 /100 | #320 | Tragic $34,647 |
| Hispanics or Latinos | 0.0 /100 | #321 | Tragic $34,421 |
| Chickasaw | 0.0 /100 | #322 | Tragic $34,414 |
| Seminole | 0.0 /100 | #323 | Tragic $34,385 |
| Immigrants | Congo | 0.0 /100 | #324 | Tragic $34,317 |
| Dutch West Indians | 0.0 /100 | #325 | Tragic $34,106 |
| Kiowa | 0.0 /100 | #326 | Tragic $34,074 |
| Cajuns | 0.0 /100 | #327 | Tragic $34,034 |
| Immigrants | Central America | 0.0 /100 | #328 | Tragic $33,953 |
| Hopi | 0.0 /100 | #329 | Tragic $33,932 |
| Menominee | 0.0 /100 | #330 | Tragic $33,894 |
| Natives/Alaskans | 0.0 /100 | #331 | Tragic $33,806 |
| Choctaw | 0.0 /100 | #332 | Tragic $33,775 |
| Mexicans | 0.0 /100 | #333 | Tragic $33,664 |
| Spanish American Indians | 0.0 /100 | #334 | Tragic $33,625 |