Chinese vs American Median Female Earnings
COMPARE
Chinese
American
Median Female Earnings
Median Female Earnings Comparison
Chinese
Americans
$41,461
MEDIAN FEMALE EARNINGS
97.5/ 100
METRIC RATING
109th/ 347
METRIC RANK
$35,777
MEDIAN FEMALE EARNINGS
0.0/ 100
METRIC RATING
292nd/ 347
METRIC RANK
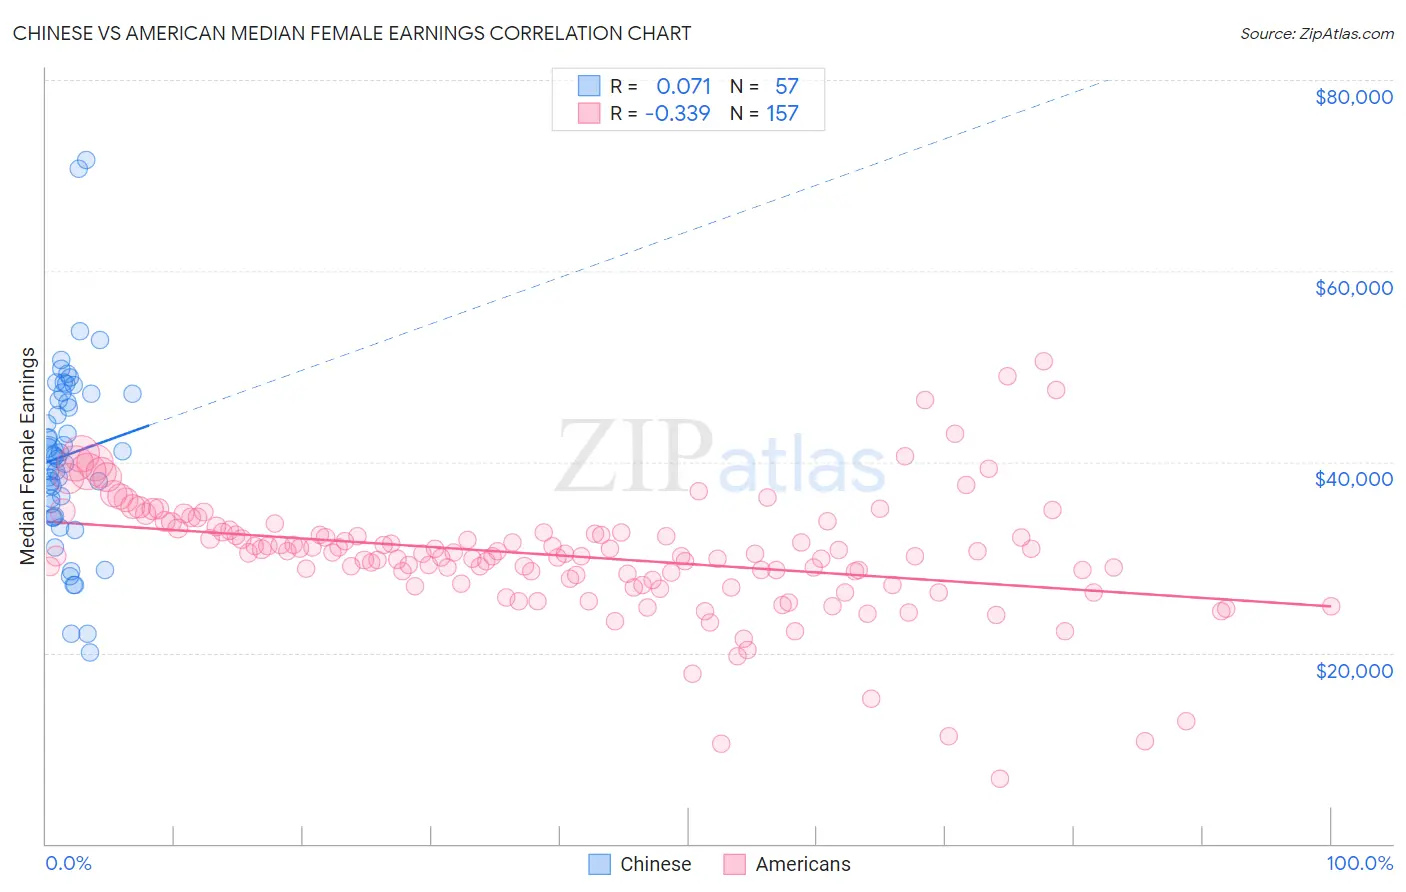
Chinese vs American Median Female Earnings Correlation Chart
The statistical analysis conducted on geographies consisting of 64,808,152 people shows a slight positive correlation between the proportion of Chinese and median female earnings in the United States with a correlation coefficient (R) of 0.071 and weighted average of $41,461. Similarly, the statistical analysis conducted on geographies consisting of 579,438,585 people shows a mild negative correlation between the proportion of Americans and median female earnings in the United States with a correlation coefficient (R) of -0.339 and weighted average of $35,777, a difference of 15.9%.
Median Female Earnings Correlation Summary
| Measurement | Chinese | American |
| Minimum | $20,043 | $6,772 |
| Maximum | $71,591 | $50,517 |
| Range | $51,548 | $43,745 |
| Mean | $40,727 | $30,170 |
| Median | $40,673 | $30,366 |
| Interquartile 25% (IQ1) | $34,915 | $27,419 |
| Interquartile 75% (IQ3) | $47,174 | $32,737 |
| Interquartile Range (IQR) | $12,258 | $5,318 |
| Standard Deviation (Sample) | $9,803 | $6,408 |
| Standard Deviation (Population) | $9,716 | $6,387 |
Similar Demographics by Median Female Earnings
Demographics Similar to Chinese by Median Female Earnings
In terms of median female earnings, the demographic groups most similar to Chinese are Jordanian ($41,464, a difference of 0.010%), Palestinian ($41,484, a difference of 0.050%), Immigrants from Eritrea ($41,485, a difference of 0.060%), Italian ($41,505, a difference of 0.10%), and Immigrants from Zimbabwe ($41,527, a difference of 0.16%).
| Demographics | Rating | Rank | Median Female Earnings |
| Immigrants | Poland | 98.2 /100 | #102 | Exceptional $41,630 |
| Immigrants | Argentina | 97.9 /100 | #103 | Exceptional $41,554 |
| Immigrants | Zimbabwe | 97.8 /100 | #104 | Exceptional $41,527 |
| Italians | 97.7 /100 | #105 | Exceptional $41,505 |
| Immigrants | Eritrea | 97.6 /100 | #106 | Exceptional $41,485 |
| Palestinians | 97.6 /100 | #107 | Exceptional $41,484 |
| Jordanians | 97.5 /100 | #108 | Exceptional $41,464 |
| Chinese | 97.5 /100 | #109 | Exceptional $41,461 |
| Immigrants | Western Asia | 97.0 /100 | #110 | Exceptional $41,375 |
| Immigrants | Canada | 97.0 /100 | #111 | Exceptional $41,373 |
| Immigrants | North America | 96.7 /100 | #112 | Exceptional $41,319 |
| Macedonians | 96.4 /100 | #113 | Exceptional $41,286 |
| Immigrants | England | 96.4 /100 | #114 | Exceptional $41,277 |
| Koreans | 96.4 /100 | #115 | Exceptional $41,276 |
| Immigrants | Brazil | 96.4 /100 | #116 | Exceptional $41,273 |
Demographics Similar to Americans by Median Female Earnings
In terms of median female earnings, the demographic groups most similar to Americans are Guatemalan ($35,695, a difference of 0.23%), Blackfeet ($35,864, a difference of 0.24%), Cheyenne ($35,673, a difference of 0.29%), Comanche ($35,661, a difference of 0.32%), and Mexican American Indian ($35,629, a difference of 0.42%).
| Demographics | Rating | Rank | Median Female Earnings |
| Paiute | 0.1 /100 | #285 | Tragic $36,056 |
| Osage | 0.0 /100 | #286 | Tragic $36,034 |
| Immigrants | Nicaragua | 0.0 /100 | #287 | Tragic $36,023 |
| Immigrants | Zaire | 0.0 /100 | #288 | Tragic $36,017 |
| Bangladeshis | 0.0 /100 | #289 | Tragic $35,960 |
| Central American Indians | 0.0 /100 | #290 | Tragic $35,930 |
| Blackfeet | 0.0 /100 | #291 | Tragic $35,864 |
| Americans | 0.0 /100 | #292 | Tragic $35,777 |
| Guatemalans | 0.0 /100 | #293 | Tragic $35,695 |
| Cheyenne | 0.0 /100 | #294 | Tragic $35,673 |
| Comanche | 0.0 /100 | #295 | Tragic $35,661 |
| Mexican American Indians | 0.0 /100 | #296 | Tragic $35,629 |
| Hmong | 0.0 /100 | #297 | Tragic $35,498 |
| Immigrants | Micronesia | 0.0 /100 | #298 | Tragic $35,477 |
| Immigrants | Guatemala | 0.0 /100 | #299 | Tragic $35,444 |