Osage vs Spanish Median Female Earnings
COMPARE
Osage
Spanish
Median Female Earnings
Median Female Earnings Comparison
Osage
Spanish
$36,034
MEDIAN FEMALE EARNINGS
0.0/ 100
METRIC RATING
286th/ 347
METRIC RANK
$38,098
MEDIAN FEMALE EARNINGS
3.5/ 100
METRIC RATING
241st/ 347
METRIC RANK
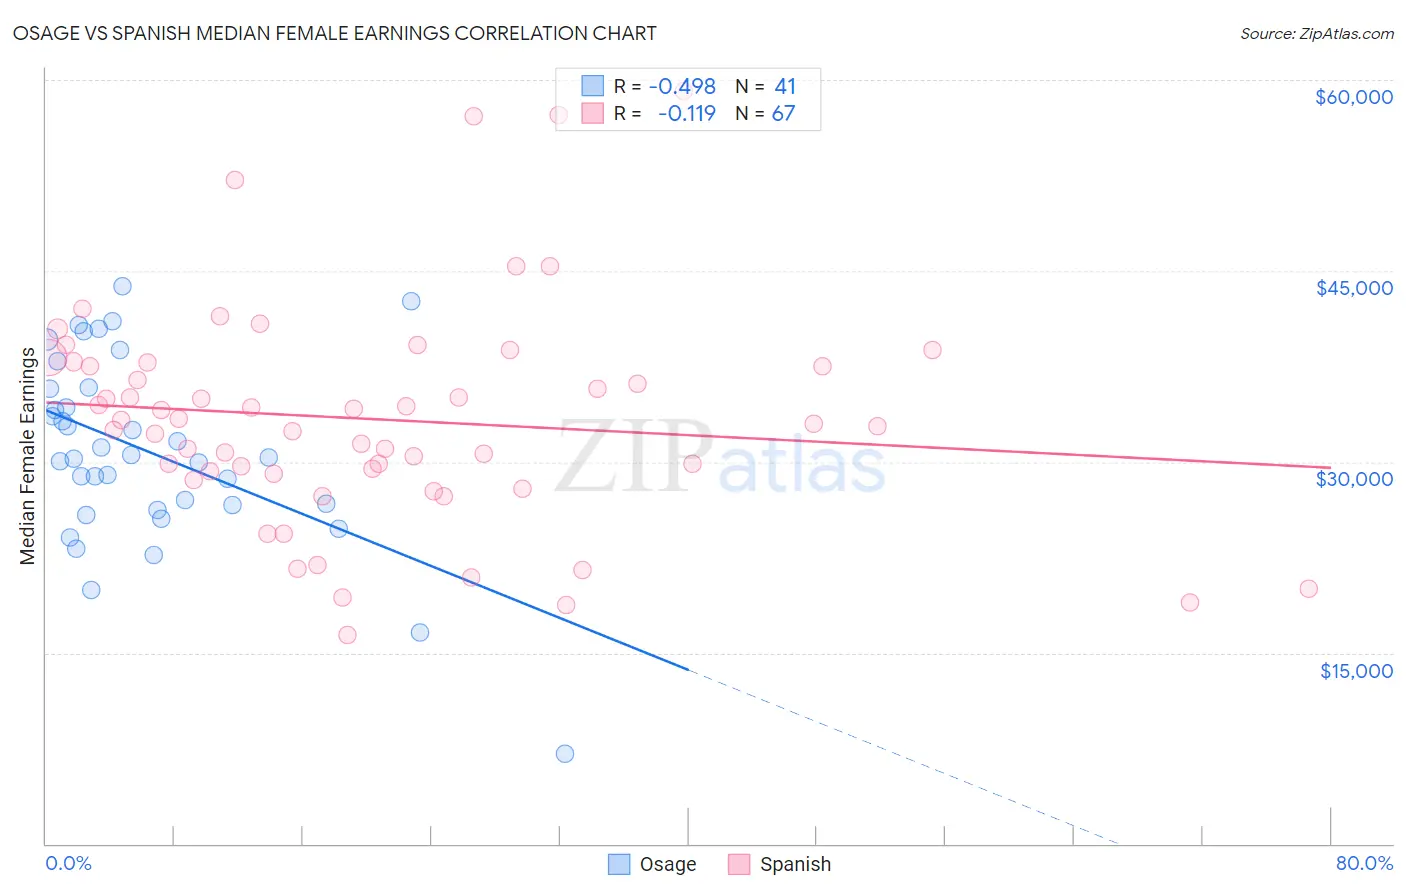
Osage vs Spanish Median Female Earnings Correlation Chart
The statistical analysis conducted on geographies consisting of 91,783,866 people shows a moderate negative correlation between the proportion of Osage and median female earnings in the United States with a correlation coefficient (R) of -0.498 and weighted average of $36,034. Similarly, the statistical analysis conducted on geographies consisting of 421,897,645 people shows a poor negative correlation between the proportion of Spanish and median female earnings in the United States with a correlation coefficient (R) of -0.119 and weighted average of $38,098, a difference of 5.7%.
Median Female Earnings Correlation Summary
| Measurement | Osage | Spanish |
| Minimum | $7,083 | $16,357 |
| Maximum | $43,750 | $59,157 |
| Range | $36,667 | $42,800 |
| Mean | $30,795 | $33,351 |
| Median | $30,332 | $33,021 |
| Interquartile 25% (IQ1) | $26,425 | $29,054 |
| Interquartile 75% (IQ3) | $35,787 | $37,790 |
| Interquartile Range (IQR) | $9,362 | $8,737 |
| Standard Deviation (Sample) | $7,435 | $8,760 |
| Standard Deviation (Population) | $7,343 | $8,694 |
Similar Demographics by Median Female Earnings
Demographics Similar to Osage by Median Female Earnings
In terms of median female earnings, the demographic groups most similar to Osage are Immigrants from Nicaragua ($36,023, a difference of 0.030%), Immigrants from Zaire ($36,017, a difference of 0.050%), Paiute ($36,056, a difference of 0.060%), Bangladeshi ($35,960, a difference of 0.21%), and Indonesian ($36,140, a difference of 0.29%).
| Demographics | Rating | Rank | Median Female Earnings |
| Immigrants | Caribbean | 0.1 /100 | #279 | Tragic $36,414 |
| Iroquois | 0.1 /100 | #280 | Tragic $36,408 |
| Spanish Americans | 0.1 /100 | #281 | Tragic $36,391 |
| Haitians | 0.1 /100 | #282 | Tragic $36,374 |
| Immigrants | Haiti | 0.1 /100 | #283 | Tragic $36,203 |
| Indonesians | 0.1 /100 | #284 | Tragic $36,140 |
| Paiute | 0.1 /100 | #285 | Tragic $36,056 |
| Osage | 0.0 /100 | #286 | Tragic $36,034 |
| Immigrants | Nicaragua | 0.0 /100 | #287 | Tragic $36,023 |
| Immigrants | Zaire | 0.0 /100 | #288 | Tragic $36,017 |
| Bangladeshis | 0.0 /100 | #289 | Tragic $35,960 |
| Central American Indians | 0.0 /100 | #290 | Tragic $35,930 |
| Blackfeet | 0.0 /100 | #291 | Tragic $35,864 |
| Americans | 0.0 /100 | #292 | Tragic $35,777 |
| Guatemalans | 0.0 /100 | #293 | Tragic $35,695 |
Demographics Similar to Spanish by Median Female Earnings
In terms of median female earnings, the demographic groups most similar to Spanish are Immigrants from Burma/Myanmar ($38,028, a difference of 0.18%), Finnish ($38,173, a difference of 0.20%), English ($38,196, a difference of 0.26%), Alaska Native ($38,202, a difference of 0.27%), and Immigrants from Cabo Verde ($38,208, a difference of 0.29%).
| Demographics | Rating | Rank | Median Female Earnings |
| Celtics | 5.0 /100 | #234 | Tragic $38,283 |
| Sudanese | 4.4 /100 | #235 | Tragic $38,215 |
| Liberians | 4.4 /100 | #236 | Tragic $38,215 |
| Immigrants | Cabo Verde | 4.3 /100 | #237 | Tragic $38,208 |
| Alaska Natives | 4.3 /100 | #238 | Tragic $38,202 |
| English | 4.2 /100 | #239 | Tragic $38,196 |
| Finns | 4.0 /100 | #240 | Tragic $38,173 |
| Spanish | 3.5 /100 | #241 | Tragic $38,098 |
| Immigrants | Burma/Myanmar | 3.0 /100 | #242 | Tragic $38,028 |
| Germans | 2.8 /100 | #243 | Tragic $37,986 |
| Immigrants | Liberia | 2.7 /100 | #244 | Tragic $37,970 |
| Immigrants | Middle Africa | 2.7 /100 | #245 | Tragic $37,965 |
| Delaware | 2.6 /100 | #246 | Tragic $37,964 |
| Immigrants | Somalia | 2.4 /100 | #247 | Tragic $37,914 |
| Alaskan Athabascans | 2.3 /100 | #248 | Tragic $37,905 |