Chinese vs Chilean Median Female Earnings
COMPARE
Chinese
Chilean
Median Female Earnings
Median Female Earnings Comparison
Chinese
Chileans
$41,461
MEDIAN FEMALE EARNINGS
97.5/ 100
METRIC RATING
109th/ 347
METRIC RANK
$40,757
MEDIAN FEMALE EARNINGS
90.0/ 100
METRIC RATING
131st/ 347
METRIC RANK
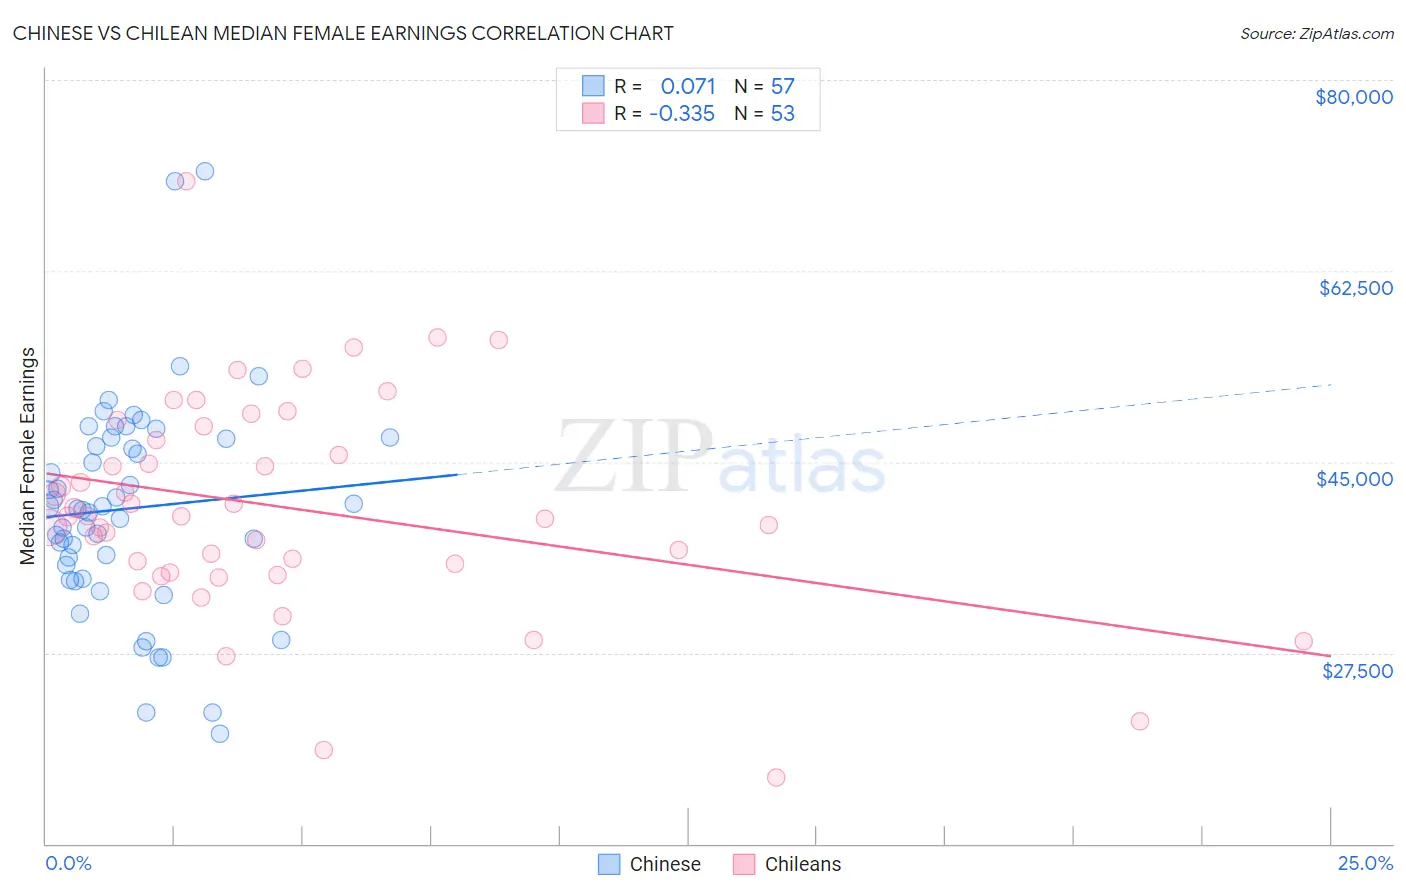
Chinese vs Chilean Median Female Earnings Correlation Chart
The statistical analysis conducted on geographies consisting of 64,808,152 people shows a slight positive correlation between the proportion of Chinese and median female earnings in the United States with a correlation coefficient (R) of 0.071 and weighted average of $41,461. Similarly, the statistical analysis conducted on geographies consisting of 256,655,155 people shows a mild negative correlation between the proportion of Chileans and median female earnings in the United States with a correlation coefficient (R) of -0.335 and weighted average of $40,757, a difference of 1.7%.
Median Female Earnings Correlation Summary
| Measurement | Chinese | Chilean |
| Minimum | $20,043 | $16,042 |
| Maximum | $71,591 | $70,707 |
| Range | $51,548 | $54,665 |
| Mean | $40,727 | $40,800 |
| Median | $40,673 | $39,990 |
| Interquartile 25% (IQ1) | $34,915 | $35,267 |
| Interquartile 75% (IQ3) | $47,174 | $47,653 |
| Interquartile Range (IQR) | $12,258 | $12,386 |
| Standard Deviation (Sample) | $9,803 | $9,907 |
| Standard Deviation (Population) | $9,716 | $9,813 |
Similar Demographics by Median Female Earnings
Demographics Similar to Chinese by Median Female Earnings
In terms of median female earnings, the demographic groups most similar to Chinese are Jordanian ($41,464, a difference of 0.010%), Palestinian ($41,484, a difference of 0.050%), Immigrants from Eritrea ($41,485, a difference of 0.060%), Italian ($41,505, a difference of 0.10%), and Immigrants from Zimbabwe ($41,527, a difference of 0.16%).
| Demographics | Rating | Rank | Median Female Earnings |
| Immigrants | Poland | 98.2 /100 | #102 | Exceptional $41,630 |
| Immigrants | Argentina | 97.9 /100 | #103 | Exceptional $41,554 |
| Immigrants | Zimbabwe | 97.8 /100 | #104 | Exceptional $41,527 |
| Italians | 97.7 /100 | #105 | Exceptional $41,505 |
| Immigrants | Eritrea | 97.6 /100 | #106 | Exceptional $41,485 |
| Palestinians | 97.6 /100 | #107 | Exceptional $41,484 |
| Jordanians | 97.5 /100 | #108 | Exceptional $41,464 |
| Chinese | 97.5 /100 | #109 | Exceptional $41,461 |
| Immigrants | Western Asia | 97.0 /100 | #110 | Exceptional $41,375 |
| Immigrants | Canada | 97.0 /100 | #111 | Exceptional $41,373 |
| Immigrants | North America | 96.7 /100 | #112 | Exceptional $41,319 |
| Macedonians | 96.4 /100 | #113 | Exceptional $41,286 |
| Immigrants | England | 96.4 /100 | #114 | Exceptional $41,277 |
| Koreans | 96.4 /100 | #115 | Exceptional $41,276 |
| Immigrants | Brazil | 96.4 /100 | #116 | Exceptional $41,273 |
Demographics Similar to Chileans by Median Female Earnings
In terms of median female earnings, the demographic groups most similar to Chileans are Immigrants from Guyana ($40,773, a difference of 0.040%), Immigrants from Uganda ($40,739, a difference of 0.040%), Syrian ($40,727, a difference of 0.070%), Zimbabwean ($40,798, a difference of 0.10%), and Arab ($40,718, a difference of 0.10%).
| Demographics | Rating | Rank | Median Female Earnings |
| Trinidadians and Tobagonians | 93.2 /100 | #124 | Exceptional $40,958 |
| Austrians | 92.7 /100 | #125 | Exceptional $40,923 |
| Immigrants | Trinidad and Tobago | 92.3 /100 | #126 | Exceptional $40,895 |
| Ugandans | 92.2 /100 | #127 | Exceptional $40,889 |
| Carpatho Rusyns | 91.2 /100 | #128 | Exceptional $40,825 |
| Zimbabweans | 90.8 /100 | #129 | Exceptional $40,798 |
| Immigrants | Guyana | 90.3 /100 | #130 | Exceptional $40,773 |
| Chileans | 90.0 /100 | #131 | Exceptional $40,757 |
| Immigrants | Uganda | 89.7 /100 | #132 | Excellent $40,739 |
| Syrians | 89.5 /100 | #133 | Excellent $40,727 |
| Arabs | 89.3 /100 | #134 | Excellent $40,718 |
| Immigrants | Nepal | 89.0 /100 | #135 | Excellent $40,704 |
| Immigrants | Eastern Africa | 87.7 /100 | #136 | Excellent $40,644 |
| Pakistanis | 86.6 /100 | #137 | Excellent $40,596 |
| Taiwanese | 86.1 /100 | #138 | Excellent $40,576 |