Ukrainian vs Spanish Median Female Earnings
COMPARE
Ukrainian
Spanish
Median Female Earnings
Median Female Earnings Comparison
Ukrainians
Spanish
$42,015
MEDIAN FEMALE EARNINGS
99.2/ 100
METRIC RATING
90th/ 347
METRIC RANK
$38,098
MEDIAN FEMALE EARNINGS
3.5/ 100
METRIC RATING
241st/ 347
METRIC RANK
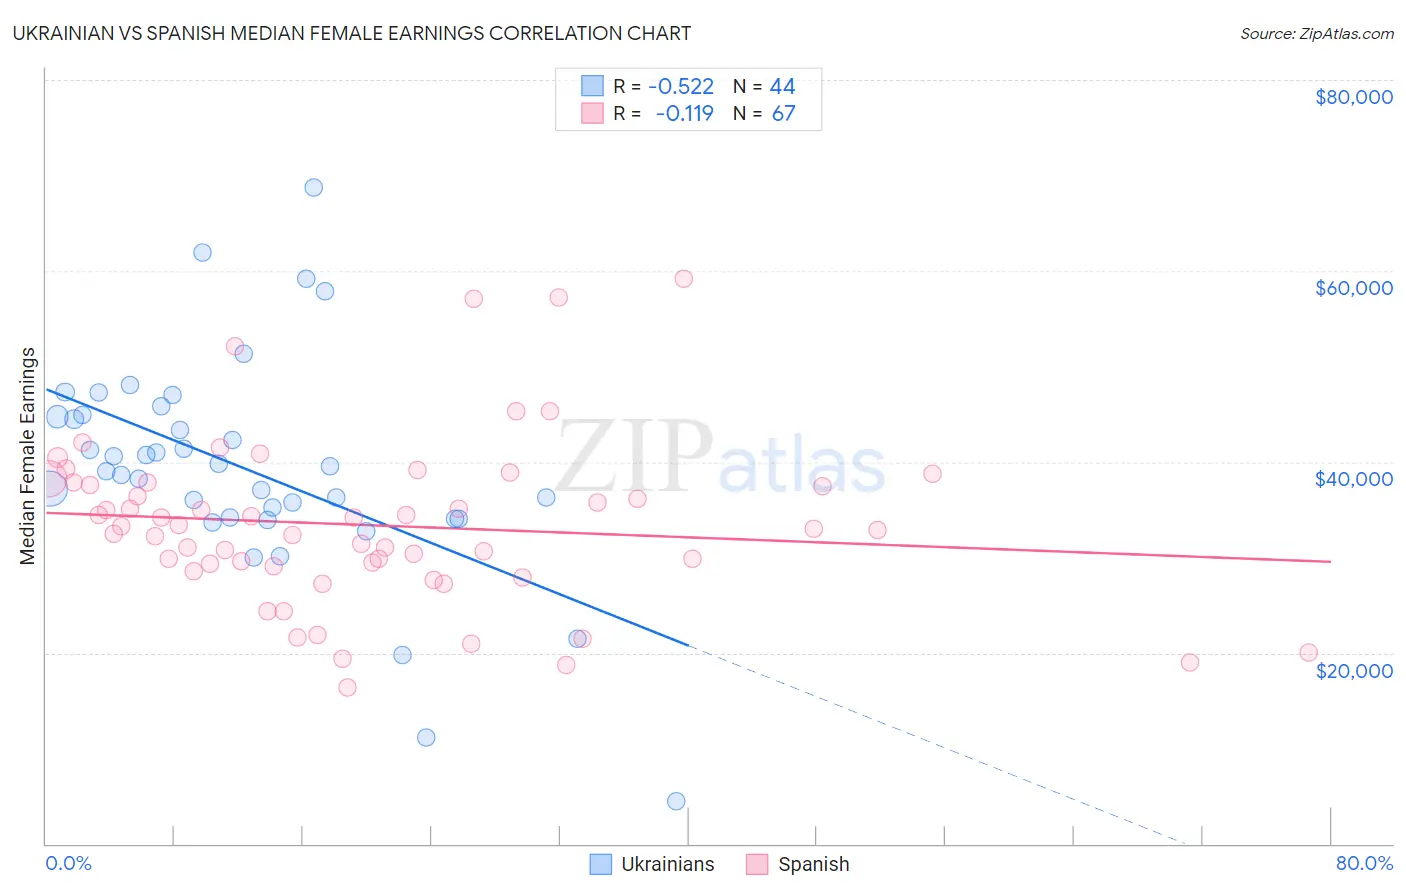
Ukrainian vs Spanish Median Female Earnings Correlation Chart
The statistical analysis conducted on geographies consisting of 448,339,242 people shows a substantial negative correlation between the proportion of Ukrainians and median female earnings in the United States with a correlation coefficient (R) of -0.522 and weighted average of $42,015. Similarly, the statistical analysis conducted on geographies consisting of 421,897,645 people shows a poor negative correlation between the proportion of Spanish and median female earnings in the United States with a correlation coefficient (R) of -0.119 and weighted average of $38,098, a difference of 10.3%.
Median Female Earnings Correlation Summary
| Measurement | Ukrainian | Spanish |
| Minimum | $4,400 | $16,357 |
| Maximum | $68,750 | $59,157 |
| Range | $64,350 | $42,800 |
| Mean | $39,267 | $33,351 |
| Median | $39,270 | $33,021 |
| Interquartile 25% (IQ1) | $34,102 | $29,054 |
| Interquartile 75% (IQ3) | $44,856 | $37,790 |
| Interquartile Range (IQR) | $10,753 | $8,737 |
| Standard Deviation (Sample) | $11,661 | $8,760 |
| Standard Deviation (Population) | $11,527 | $8,694 |
Similar Demographics by Median Female Earnings
Demographics Similar to Ukrainians by Median Female Earnings
In terms of median female earnings, the demographic groups most similar to Ukrainians are Immigrants from Western Europe ($41,990, a difference of 0.060%), Immigrants from Afghanistan ($42,055, a difference of 0.10%), Argentinean ($41,952, a difference of 0.15%), Immigrants from Northern Africa ($42,084, a difference of 0.16%), and Immigrants from Grenada ($41,932, a difference of 0.20%).
| Demographics | Rating | Rank | Median Female Earnings |
| Immigrants | Sierra Leone | 99.5 /100 | #83 | Exceptional $42,214 |
| Armenians | 99.5 /100 | #84 | Exceptional $42,212 |
| Laotians | 99.4 /100 | #85 | Exceptional $42,133 |
| Immigrants | St. Vincent and the Grenadines | 99.3 /100 | #86 | Exceptional $42,108 |
| Lithuanians | 99.3 /100 | #87 | Exceptional $42,108 |
| Immigrants | Northern Africa | 99.3 /100 | #88 | Exceptional $42,084 |
| Immigrants | Afghanistan | 99.3 /100 | #89 | Exceptional $42,055 |
| Ukrainians | 99.2 /100 | #90 | Exceptional $42,015 |
| Immigrants | Western Europe | 99.2 /100 | #91 | Exceptional $41,990 |
| Argentineans | 99.1 /100 | #92 | Exceptional $41,952 |
| Immigrants | Grenada | 99.0 /100 | #93 | Exceptional $41,932 |
| Moroccans | 98.9 /100 | #94 | Exceptional $41,872 |
| Immigrants | Netherlands | 98.9 /100 | #95 | Exceptional $41,870 |
| South Africans | 98.8 /100 | #96 | Exceptional $41,825 |
| Immigrants | Hungary | 98.8 /100 | #97 | Exceptional $41,820 |
Demographics Similar to Spanish by Median Female Earnings
In terms of median female earnings, the demographic groups most similar to Spanish are Immigrants from Burma/Myanmar ($38,028, a difference of 0.18%), Finnish ($38,173, a difference of 0.20%), English ($38,196, a difference of 0.26%), Alaska Native ($38,202, a difference of 0.27%), and Immigrants from Cabo Verde ($38,208, a difference of 0.29%).
| Demographics | Rating | Rank | Median Female Earnings |
| Celtics | 5.0 /100 | #234 | Tragic $38,283 |
| Sudanese | 4.4 /100 | #235 | Tragic $38,215 |
| Liberians | 4.4 /100 | #236 | Tragic $38,215 |
| Immigrants | Cabo Verde | 4.3 /100 | #237 | Tragic $38,208 |
| Alaska Natives | 4.3 /100 | #238 | Tragic $38,202 |
| English | 4.2 /100 | #239 | Tragic $38,196 |
| Finns | 4.0 /100 | #240 | Tragic $38,173 |
| Spanish | 3.5 /100 | #241 | Tragic $38,098 |
| Immigrants | Burma/Myanmar | 3.0 /100 | #242 | Tragic $38,028 |
| Germans | 2.8 /100 | #243 | Tragic $37,986 |
| Immigrants | Liberia | 2.7 /100 | #244 | Tragic $37,970 |
| Immigrants | Middle Africa | 2.7 /100 | #245 | Tragic $37,965 |
| Delaware | 2.6 /100 | #246 | Tragic $37,964 |
| Immigrants | Somalia | 2.4 /100 | #247 | Tragic $37,914 |
| Alaskan Athabascans | 2.3 /100 | #248 | Tragic $37,905 |