Chinese vs Spanish Disability Age Under 5
COMPARE
Chinese
Spanish
Disability Age Under 5
Disability Age Under 5 Comparison
Chinese
Spanish
1.1%
DISABILITY AGE UNDER 5
97.2/ 100
METRIC RATING
90th/ 347
METRIC RANK
1.4%
DISABILITY AGE UNDER 5
0.2/ 100
METRIC RATING
263rd/ 347
METRIC RANK
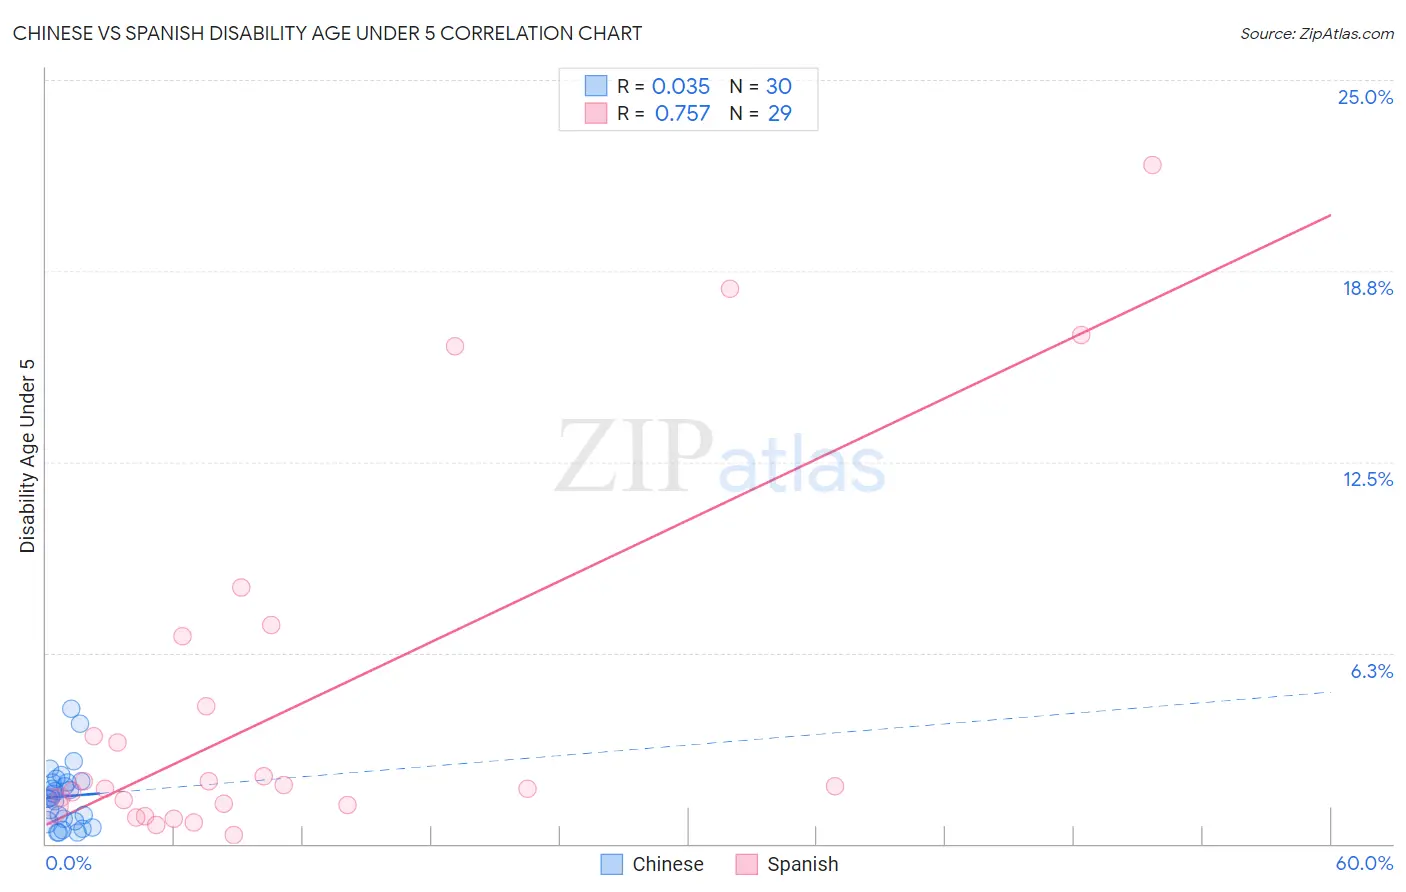
Chinese vs Spanish Disability Age Under 5 Correlation Chart
The statistical analysis conducted on geographies consisting of 53,046,332 people shows no correlation between the proportion of Chinese and percentage of population with a disability under the age of 5 in the United States with a correlation coefficient (R) of 0.035 and weighted average of 1.1%. Similarly, the statistical analysis conducted on geographies consisting of 226,460,629 people shows a strong positive correlation between the proportion of Spanish and percentage of population with a disability under the age of 5 in the United States with a correlation coefficient (R) of 0.757 and weighted average of 1.4%, a difference of 24.5%.
Disability Age Under 5 Correlation Summary
| Measurement | Chinese | Spanish |
| Minimum | 0.35% | 0.27% |
| Maximum | 4.4% | 22.2% |
| Range | 4.0% | 21.9% |
| Mean | 1.5% | 4.6% |
| Median | 1.5% | 1.9% |
| Interquartile 25% (IQ1) | 0.75% | 1.2% |
| Interquartile 75% (IQ3) | 2.0% | 5.7% |
| Interquartile Range (IQR) | 1.3% | 4.4% |
| Standard Deviation (Sample) | 0.98% | 6.0% |
| Standard Deviation (Population) | 0.97% | 5.9% |
Similar Demographics by Disability Age Under 5
Demographics Similar to Chinese by Disability Age Under 5
In terms of disability age under 5, the demographic groups most similar to Chinese are Ethiopian (1.1%, a difference of 0.030%), Albanian (1.1%, a difference of 0.040%), Immigrants from Cuba (1.1%, a difference of 0.21%), Spanish American (1.1%, a difference of 0.24%), and Sri Lankan (1.1%, a difference of 0.30%).
| Demographics | Rating | Rank | Disability Age Under 5 |
| Immigrants | Syria | 97.9 /100 | #83 | Exceptional 1.1% |
| Immigrants | Zaire | 97.8 /100 | #84 | Exceptional 1.1% |
| Sudanese | 97.7 /100 | #85 | Exceptional 1.1% |
| Okinawans | 97.6 /100 | #86 | Exceptional 1.1% |
| Ugandans | 97.5 /100 | #87 | Exceptional 1.1% |
| Immigrants | Dominican Republic | 97.5 /100 | #88 | Exceptional 1.1% |
| Ethiopians | 97.2 /100 | #89 | Exceptional 1.1% |
| Chinese | 97.2 /100 | #90 | Exceptional 1.1% |
| Albanians | 97.2 /100 | #91 | Exceptional 1.1% |
| Immigrants | Cuba | 97.0 /100 | #92 | Exceptional 1.1% |
| Spanish Americans | 96.9 /100 | #93 | Exceptional 1.1% |
| Sri Lankans | 96.8 /100 | #94 | Exceptional 1.1% |
| Immigrants | Moldova | 96.8 /100 | #95 | Exceptional 1.1% |
| Mongolians | 96.6 /100 | #96 | Exceptional 1.1% |
| Immigrants | Iraq | 96.5 /100 | #97 | Exceptional 1.1% |
Demographics Similar to Spanish by Disability Age Under 5
In terms of disability age under 5, the demographic groups most similar to Spanish are Immigrants from Dominica (1.4%, a difference of 0.060%), Yugoslavian (1.4%, a difference of 0.15%), Carpatho Rusyn (1.4%, a difference of 0.19%), Immigrants from Netherlands (1.4%, a difference of 0.22%), and Immigrants from Germany (1.4%, a difference of 0.22%).
| Demographics | Rating | Rank | Disability Age Under 5 |
| Immigrants | Western Europe | 0.5 /100 | #256 | Tragic 1.4% |
| Slovenes | 0.3 /100 | #257 | Tragic 1.4% |
| Costa Ricans | 0.3 /100 | #258 | Tragic 1.4% |
| Immigrants | Southern Europe | 0.3 /100 | #259 | Tragic 1.4% |
| Slavs | 0.3 /100 | #260 | Tragic 1.4% |
| Immigrants | Netherlands | 0.2 /100 | #261 | Tragic 1.4% |
| Immigrants | Dominica | 0.2 /100 | #262 | Tragic 1.4% |
| Spanish | 0.2 /100 | #263 | Tragic 1.4% |
| Yugoslavians | 0.1 /100 | #264 | Tragic 1.4% |
| Carpatho Rusyns | 0.1 /100 | #265 | Tragic 1.4% |
| Immigrants | Germany | 0.1 /100 | #266 | Tragic 1.4% |
| Cree | 0.1 /100 | #267 | Tragic 1.4% |
| Belgians | 0.1 /100 | #268 | Tragic 1.4% |
| Austrians | 0.1 /100 | #269 | Tragic 1.4% |
| Immigrants | North America | 0.1 /100 | #270 | Tragic 1.4% |