Cheyenne vs Soviet Union Female Poverty Among 25-34 Year Olds
COMPARE
Cheyenne
Soviet Union
Female Poverty Among 25-34 Year Olds
Female Poverty Among 25-34 Year Olds Comparison
Cheyenne
Soviet Union
19.1%
FEMALE POVERTY AMONG 25-34 YEAR OLDS
0.0/ 100
METRIC RATING
327th/ 347
METRIC RANK
12.1%
FEMALE POVERTY AMONG 25-34 YEAR OLDS
99.3/ 100
METRIC RATING
63rd/ 347
METRIC RANK
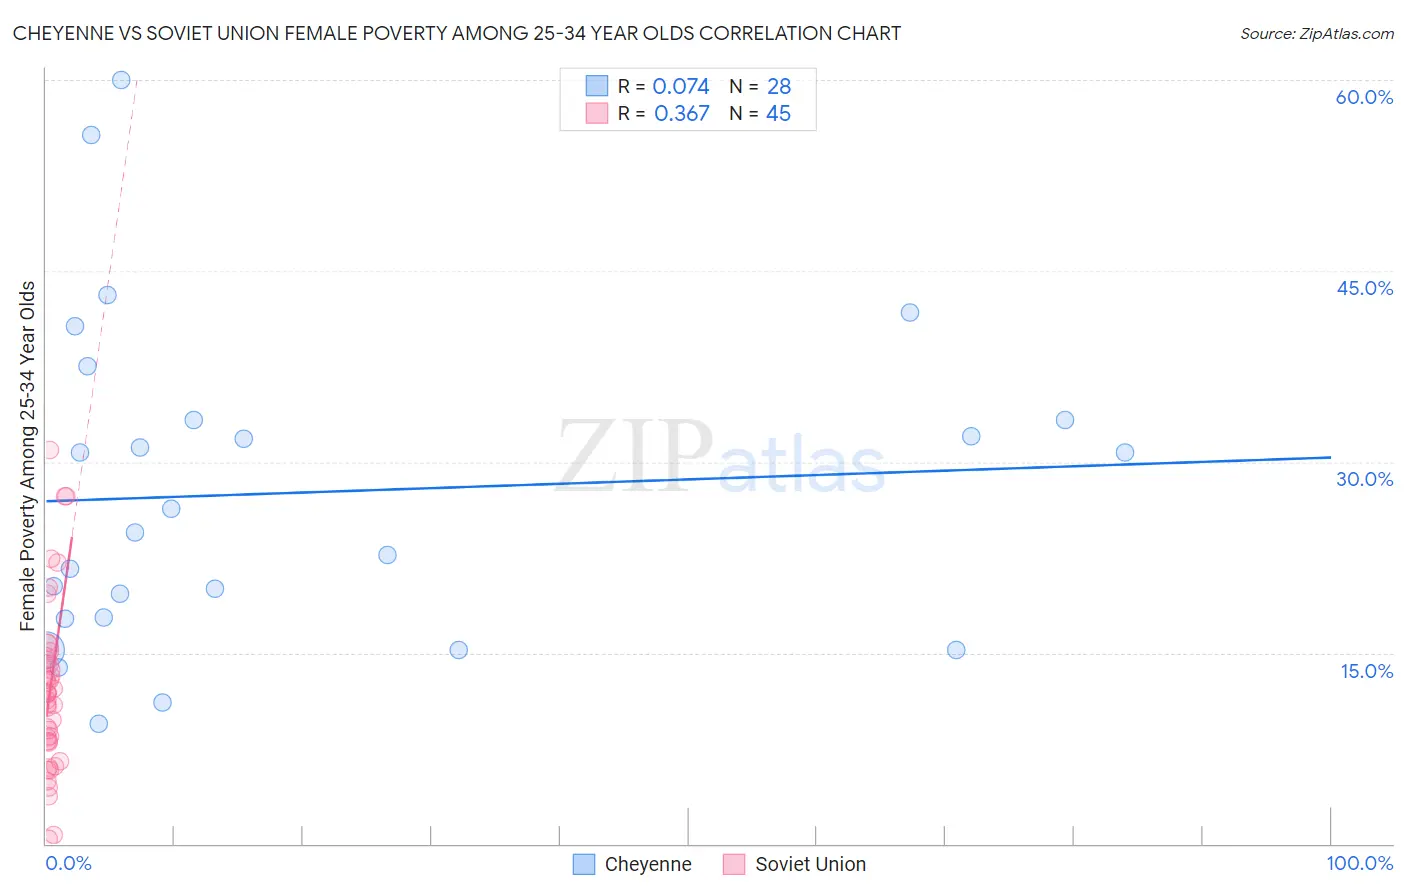
Cheyenne vs Soviet Union Female Poverty Among 25-34 Year Olds Correlation Chart
The statistical analysis conducted on geographies consisting of 80,457,436 people shows a slight positive correlation between the proportion of Cheyenne and poverty level among females between the ages 25 and 34 in the United States with a correlation coefficient (R) of 0.074 and weighted average of 19.1%. Similarly, the statistical analysis conducted on geographies consisting of 43,444,949 people shows a mild positive correlation between the proportion of Soviet Union and poverty level among females between the ages 25 and 34 in the United States with a correlation coefficient (R) of 0.367 and weighted average of 12.1%, a difference of 57.4%.
Female Poverty Among 25-34 Year Olds Correlation Summary
| Measurement | Cheyenne | Soviet Union |
| Minimum | 9.4% | 0.43% |
| Maximum | 60.0% | 31.0% |
| Range | 50.6% | 30.5% |
| Mean | 27.6% | 12.1% |
| Median | 25.4% | 11.8% |
| Interquartile 25% (IQ1) | 17.7% | 8.0% |
| Interquartile 75% (IQ3) | 33.3% | 14.5% |
| Interquartile Range (IQR) | 15.6% | 6.5% |
| Standard Deviation (Sample) | 12.7% | 6.6% |
| Standard Deviation (Population) | 12.5% | 6.6% |
Similar Demographics by Female Poverty Among 25-34 Year Olds
Demographics Similar to Cheyenne by Female Poverty Among 25-34 Year Olds
In terms of female poverty among 25-34 year olds, the demographic groups most similar to Cheyenne are Alaskan Athabascan (19.1%, a difference of 0.080%), Creek (19.2%, a difference of 0.33%), Black/African American (18.9%, a difference of 0.96%), Paiute (19.6%, a difference of 2.6%), and Kiowa (19.7%, a difference of 3.0%).
| Demographics | Rating | Rank | Female Poverty Among 25-34 Year Olds |
| Chippewa | 0.0 /100 | #320 | Tragic 18.0% |
| Choctaw | 0.0 /100 | #321 | Tragic 18.1% |
| Central American Indians | 0.0 /100 | #322 | Tragic 18.2% |
| Seminole | 0.0 /100 | #323 | Tragic 18.3% |
| Dutch West Indians | 0.0 /100 | #324 | Tragic 18.4% |
| Inupiat | 0.0 /100 | #325 | Tragic 18.5% |
| Blacks/African Americans | 0.0 /100 | #326 | Tragic 18.9% |
| Cheyenne | 0.0 /100 | #327 | Tragic 19.1% |
| Alaskan Athabascans | 0.0 /100 | #328 | Tragic 19.1% |
| Creek | 0.0 /100 | #329 | Tragic 19.2% |
| Paiute | 0.0 /100 | #330 | Tragic 19.6% |
| Kiowa | 0.0 /100 | #331 | Tragic 19.7% |
| Immigrants | Yemen | 0.0 /100 | #332 | Tragic 19.8% |
| Cajuns | 0.0 /100 | #333 | Tragic 19.9% |
| Apache | 0.0 /100 | #334 | Tragic 20.1% |
Demographics Similar to Soviet Union by Female Poverty Among 25-34 Year Olds
In terms of female poverty among 25-34 year olds, the demographic groups most similar to Soviet Union are Immigrants from Moldova (12.1%, a difference of 0.010%), Immigrants from Czechoslovakia (12.1%, a difference of 0.18%), Immigrants from Northern Europe (12.1%, a difference of 0.21%), Immigrants from Russia (12.2%, a difference of 0.24%), and Armenian (12.2%, a difference of 0.25%).
| Demographics | Rating | Rank | Female Poverty Among 25-34 Year Olds |
| Luxembourgers | 99.5 /100 | #56 | Exceptional 12.1% |
| Jordanians | 99.4 /100 | #57 | Exceptional 12.1% |
| Immigrants | Romania | 99.4 /100 | #58 | Exceptional 12.1% |
| Russians | 99.4 /100 | #59 | Exceptional 12.1% |
| Immigrants | Northern Europe | 99.4 /100 | #60 | Exceptional 12.1% |
| Immigrants | Czechoslovakia | 99.4 /100 | #61 | Exceptional 12.1% |
| Immigrants | Moldova | 99.3 /100 | #62 | Exceptional 12.1% |
| Soviet Union | 99.3 /100 | #63 | Exceptional 12.1% |
| Immigrants | Russia | 99.2 /100 | #64 | Exceptional 12.2% |
| Armenians | 99.2 /100 | #65 | Exceptional 12.2% |
| Immigrants | Europe | 99.2 /100 | #66 | Exceptional 12.2% |
| Laotians | 99.2 /100 | #67 | Exceptional 12.2% |
| Sri Lankans | 99.1 /100 | #68 | Exceptional 12.2% |
| Immigrants | Lebanon | 99.1 /100 | #69 | Exceptional 12.2% |
| Immigrants | Belgium | 99.1 /100 | #70 | Exceptional 12.2% |