Cheyenne vs Immigrants from Austria Per Capita Income
COMPARE
Cheyenne
Immigrants from Austria
Per Capita Income
Per Capita Income Comparison
Cheyenne
Immigrants from Austria
$35,276
PER CAPITA INCOME
0.0/ 100
METRIC RATING
323rd/ 347
METRIC RANK
$52,503
PER CAPITA INCOME
100.0/ 100
METRIC RATING
30th/ 347
METRIC RANK
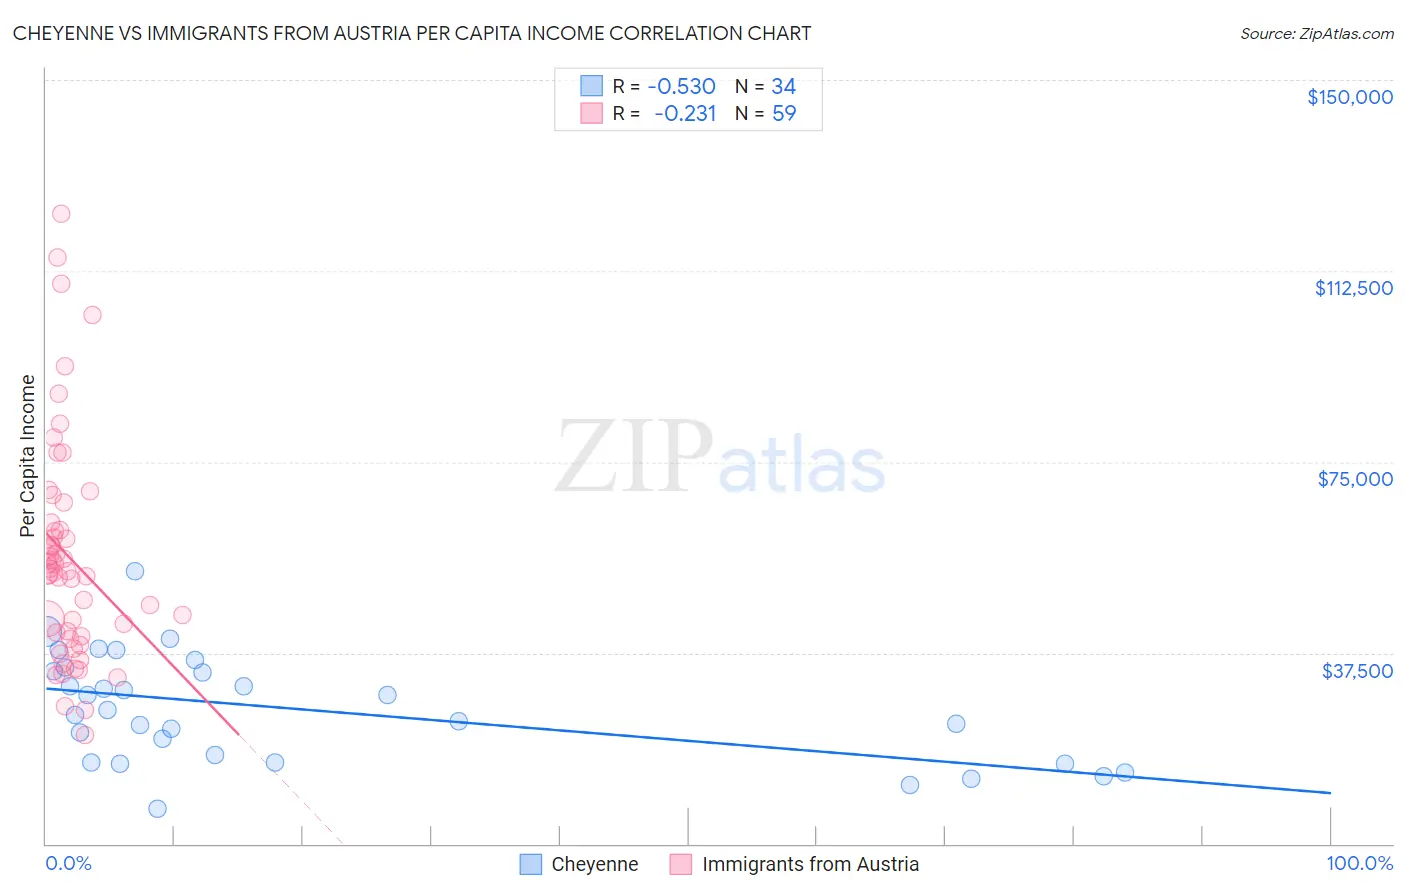
Cheyenne vs Immigrants from Austria Per Capita Income Correlation Chart
The statistical analysis conducted on geographies consisting of 80,722,590 people shows a substantial negative correlation between the proportion of Cheyenne and per capita income in the United States with a correlation coefficient (R) of -0.530 and weighted average of $35,276. Similarly, the statistical analysis conducted on geographies consisting of 167,970,589 people shows a weak negative correlation between the proportion of Immigrants from Austria and per capita income in the United States with a correlation coefficient (R) of -0.231 and weighted average of $52,503, a difference of 48.8%.
Per Capita Income Correlation Summary
| Measurement | Cheyenne | Immigrants from Austria |
| Minimum | $6,772 | $21,347 |
| Maximum | $53,471 | $123,682 |
| Range | $46,699 | $102,335 |
| Mean | $26,352 | $56,412 |
| Median | $25,776 | $53,535 |
| Interquartile 25% (IQ1) | $15,918 | $40,769 |
| Interquartile 75% (IQ3) | $33,955 | $63,066 |
| Interquartile Range (IQR) | $18,037 | $22,297 |
| Standard Deviation (Sample) | $10,544 | $21,800 |
| Standard Deviation (Population) | $10,388 | $21,614 |
Similar Demographics by Per Capita Income
Demographics Similar to Cheyenne by Per Capita Income
In terms of per capita income, the demographic groups most similar to Cheyenne are Kiowa ($35,102, a difference of 0.50%), Creek ($35,546, a difference of 0.76%), Black/African American ($35,564, a difference of 0.82%), Immigrants from Central America ($34,974, a difference of 0.87%), and Immigrants from Cuba ($34,910, a difference of 1.1%).
| Demographics | Rating | Rank | Per Capita Income |
| Choctaw | 0.0 /100 | #316 | Tragic $35,999 |
| Dutch West Indians | 0.0 /100 | #317 | Tragic $35,922 |
| Bangladeshis | 0.0 /100 | #318 | Tragic $35,897 |
| Immigrants | Congo | 0.0 /100 | #319 | Tragic $35,720 |
| Hispanics or Latinos | 0.0 /100 | #320 | Tragic $35,688 |
| Blacks/African Americans | 0.0 /100 | #321 | Tragic $35,564 |
| Creek | 0.0 /100 | #322 | Tragic $35,546 |
| Cheyenne | 0.0 /100 | #323 | Tragic $35,276 |
| Kiowa | 0.0 /100 | #324 | Tragic $35,102 |
| Immigrants | Central America | 0.0 /100 | #325 | Tragic $34,974 |
| Immigrants | Cuba | 0.0 /100 | #326 | Tragic $34,910 |
| Apache | 0.0 /100 | #327 | Tragic $34,886 |
| Menominee | 0.0 /100 | #328 | Tragic $34,578 |
| Mexicans | 0.0 /100 | #329 | Tragic $34,559 |
| Spanish American Indians | 0.0 /100 | #330 | Tragic $34,195 |
Demographics Similar to Immigrants from Austria by Per Capita Income
In terms of per capita income, the demographic groups most similar to Immigrants from Austria are Israeli ($52,596, a difference of 0.18%), Turkish ($52,391, a difference of 0.21%), Latvian ($52,649, a difference of 0.28%), Immigrants from South Central Asia ($52,660, a difference of 0.30%), and Immigrants from Norway ($52,217, a difference of 0.55%).
| Demographics | Rating | Rank | Per Capita Income |
| Immigrants | Eastern Asia | 100.0 /100 | #23 | Exceptional $53,806 |
| Immigrants | Denmark | 100.0 /100 | #24 | Exceptional $53,799 |
| Immigrants | Japan | 100.0 /100 | #25 | Exceptional $53,359 |
| Russians | 100.0 /100 | #26 | Exceptional $53,154 |
| Immigrants | South Central Asia | 100.0 /100 | #27 | Exceptional $52,660 |
| Latvians | 100.0 /100 | #28 | Exceptional $52,649 |
| Israelis | 100.0 /100 | #29 | Exceptional $52,596 |
| Immigrants | Austria | 100.0 /100 | #30 | Exceptional $52,503 |
| Turks | 100.0 /100 | #31 | Exceptional $52,391 |
| Immigrants | Norway | 100.0 /100 | #32 | Exceptional $52,217 |
| Australians | 100.0 /100 | #33 | Exceptional $52,074 |
| Immigrants | Russia | 100.0 /100 | #34 | Exceptional $52,044 |
| Burmese | 100.0 /100 | #35 | Exceptional $52,005 |
| Immigrants | Greece | 100.0 /100 | #36 | Exceptional $51,891 |
| Estonians | 100.0 /100 | #37 | Exceptional $51,875 |