Cheyenne vs Immigrants from Jamaica Per Capita Income
COMPARE
Cheyenne
Immigrants from Jamaica
Per Capita Income
Per Capita Income Comparison
Cheyenne
Immigrants from Jamaica
$35,276
PER CAPITA INCOME
0.0/ 100
METRIC RATING
323rd/ 347
METRIC RANK
$38,766
PER CAPITA INCOME
0.4/ 100
METRIC RATING
269th/ 347
METRIC RANK
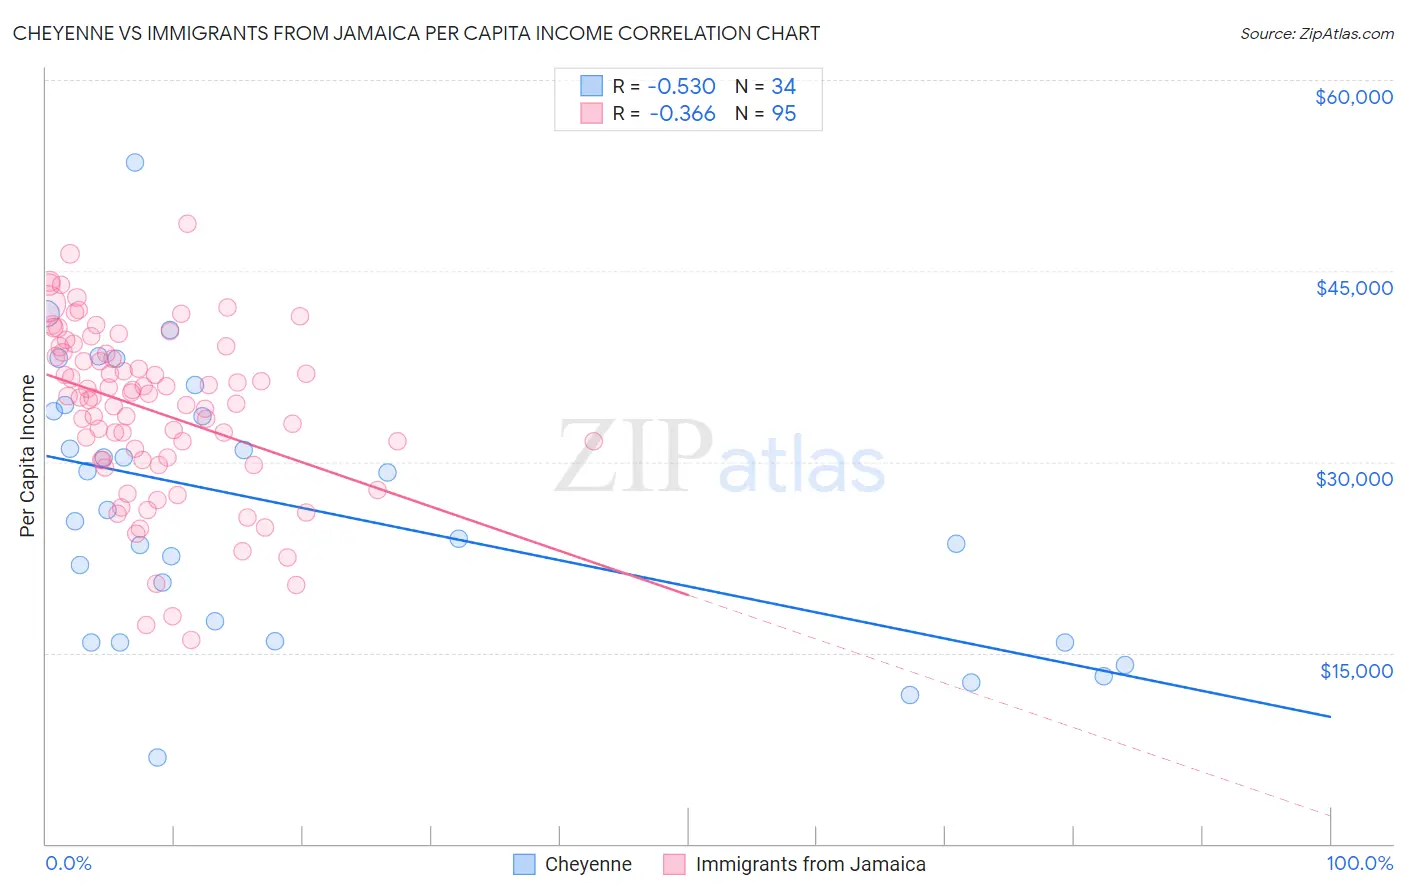
Cheyenne vs Immigrants from Jamaica Per Capita Income Correlation Chart
The statistical analysis conducted on geographies consisting of 80,722,590 people shows a substantial negative correlation between the proportion of Cheyenne and per capita income in the United States with a correlation coefficient (R) of -0.530 and weighted average of $35,276. Similarly, the statistical analysis conducted on geographies consisting of 301,814,943 people shows a mild negative correlation between the proportion of Immigrants from Jamaica and per capita income in the United States with a correlation coefficient (R) of -0.366 and weighted average of $38,766, a difference of 9.9%.
Per Capita Income Correlation Summary
| Measurement | Cheyenne | Immigrants from Jamaica |
| Minimum | $6,772 | $16,033 |
| Maximum | $53,471 | $48,680 |
| Range | $46,699 | $32,647 |
| Mean | $26,352 | $34,027 |
| Median | $25,776 | $35,066 |
| Interquartile 25% (IQ1) | $15,918 | $30,104 |
| Interquartile 75% (IQ3) | $33,955 | $38,633 |
| Interquartile Range (IQR) | $18,037 | $8,529 |
| Standard Deviation (Sample) | $10,544 | $6,626 |
| Standard Deviation (Population) | $10,388 | $6,591 |
Similar Demographics by Per Capita Income
Demographics Similar to Cheyenne by Per Capita Income
In terms of per capita income, the demographic groups most similar to Cheyenne are Kiowa ($35,102, a difference of 0.50%), Creek ($35,546, a difference of 0.76%), Black/African American ($35,564, a difference of 0.82%), Immigrants from Central America ($34,974, a difference of 0.87%), and Immigrants from Cuba ($34,910, a difference of 1.1%).
| Demographics | Rating | Rank | Per Capita Income |
| Choctaw | 0.0 /100 | #316 | Tragic $35,999 |
| Dutch West Indians | 0.0 /100 | #317 | Tragic $35,922 |
| Bangladeshis | 0.0 /100 | #318 | Tragic $35,897 |
| Immigrants | Congo | 0.0 /100 | #319 | Tragic $35,720 |
| Hispanics or Latinos | 0.0 /100 | #320 | Tragic $35,688 |
| Blacks/African Americans | 0.0 /100 | #321 | Tragic $35,564 |
| Creek | 0.0 /100 | #322 | Tragic $35,546 |
| Cheyenne | 0.0 /100 | #323 | Tragic $35,276 |
| Kiowa | 0.0 /100 | #324 | Tragic $35,102 |
| Immigrants | Central America | 0.0 /100 | #325 | Tragic $34,974 |
| Immigrants | Cuba | 0.0 /100 | #326 | Tragic $34,910 |
| Apache | 0.0 /100 | #327 | Tragic $34,886 |
| Menominee | 0.0 /100 | #328 | Tragic $34,578 |
| Mexicans | 0.0 /100 | #329 | Tragic $34,559 |
| Spanish American Indians | 0.0 /100 | #330 | Tragic $34,195 |
Demographics Similar to Immigrants from Jamaica by Per Capita Income
In terms of per capita income, the demographic groups most similar to Immigrants from Jamaica are Liberian ($38,780, a difference of 0.040%), Immigrants from Zaire ($38,848, a difference of 0.21%), Salvadoran ($38,858, a difference of 0.24%), Immigrants from Belize ($38,614, a difference of 0.39%), and Central American ($38,560, a difference of 0.53%).
| Demographics | Rating | Rank | Per Capita Income |
| Iroquois | 0.6 /100 | #262 | Tragic $39,104 |
| Belizeans | 0.6 /100 | #263 | Tragic $39,097 |
| Americans | 0.6 /100 | #264 | Tragic $39,039 |
| Spanish Americans | 0.5 /100 | #265 | Tragic $39,012 |
| Salvadorans | 0.5 /100 | #266 | Tragic $38,858 |
| Immigrants | Zaire | 0.4 /100 | #267 | Tragic $38,848 |
| Liberians | 0.4 /100 | #268 | Tragic $38,780 |
| Immigrants | Jamaica | 0.4 /100 | #269 | Tragic $38,766 |
| Immigrants | Belize | 0.3 /100 | #270 | Tragic $38,614 |
| Central Americans | 0.3 /100 | #271 | Tragic $38,560 |
| Immigrants | Cabo Verde | 0.3 /100 | #272 | Tragic $38,540 |
| Nepalese | 0.3 /100 | #273 | Tragic $38,442 |
| Immigrants | El Salvador | 0.3 /100 | #274 | Tragic $38,394 |
| Immigrants | Liberia | 0.2 /100 | #275 | Tragic $38,165 |
| Hmong | 0.2 /100 | #276 | Tragic $38,120 |