Cheyenne vs Immigrants from Eastern Europe Per Capita Income
COMPARE
Cheyenne
Immigrants from Eastern Europe
Per Capita Income
Per Capita Income Comparison
Cheyenne
Immigrants from Eastern Europe
$35,276
PER CAPITA INCOME
0.0/ 100
METRIC RATING
323rd/ 347
METRIC RANK
$49,316
PER CAPITA INCOME
99.8/ 100
METRIC RATING
70th/ 347
METRIC RANK
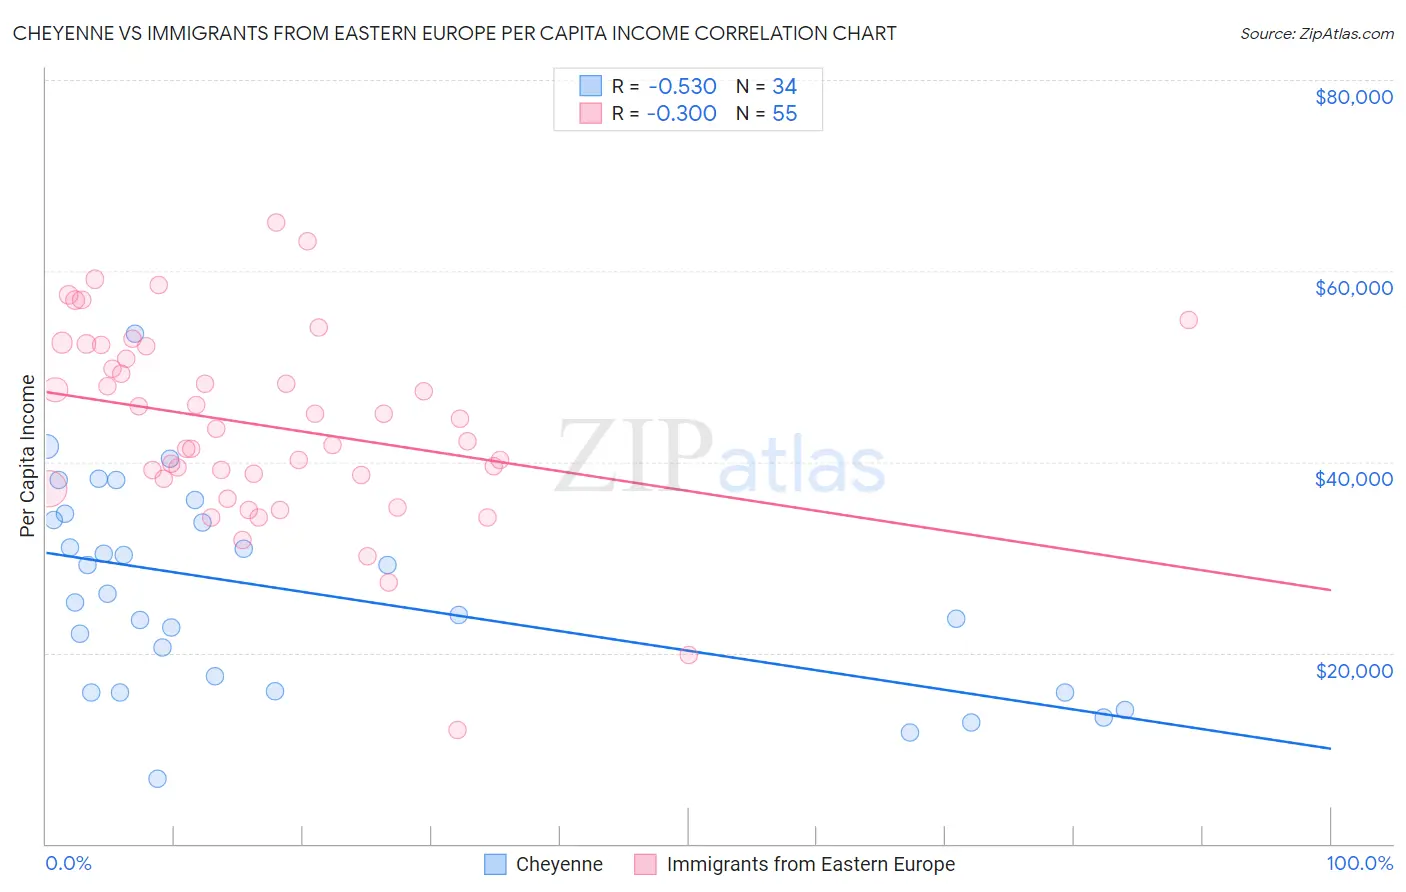
Cheyenne vs Immigrants from Eastern Europe Per Capita Income Correlation Chart
The statistical analysis conducted on geographies consisting of 80,722,590 people shows a substantial negative correlation between the proportion of Cheyenne and per capita income in the United States with a correlation coefficient (R) of -0.530 and weighted average of $35,276. Similarly, the statistical analysis conducted on geographies consisting of 475,909,119 people shows a mild negative correlation between the proportion of Immigrants from Eastern Europe and per capita income in the United States with a correlation coefficient (R) of -0.300 and weighted average of $49,316, a difference of 39.8%.
Per Capita Income Correlation Summary
| Measurement | Cheyenne | Immigrants from Eastern Europe |
| Minimum | $6,772 | $11,876 |
| Maximum | $53,471 | $65,115 |
| Range | $46,699 | $53,239 |
| Mean | $26,352 | $43,803 |
| Median | $25,776 | $43,497 |
| Interquartile 25% (IQ1) | $15,918 | $38,232 |
| Interquartile 75% (IQ3) | $33,955 | $52,105 |
| Interquartile Range (IQR) | $18,037 | $13,872 |
| Standard Deviation (Sample) | $10,544 | $10,236 |
| Standard Deviation (Population) | $10,388 | $10,143 |
Similar Demographics by Per Capita Income
Demographics Similar to Cheyenne by Per Capita Income
In terms of per capita income, the demographic groups most similar to Cheyenne are Kiowa ($35,102, a difference of 0.50%), Creek ($35,546, a difference of 0.76%), Black/African American ($35,564, a difference of 0.82%), Immigrants from Central America ($34,974, a difference of 0.87%), and Immigrants from Cuba ($34,910, a difference of 1.1%).
| Demographics | Rating | Rank | Per Capita Income |
| Choctaw | 0.0 /100 | #316 | Tragic $35,999 |
| Dutch West Indians | 0.0 /100 | #317 | Tragic $35,922 |
| Bangladeshis | 0.0 /100 | #318 | Tragic $35,897 |
| Immigrants | Congo | 0.0 /100 | #319 | Tragic $35,720 |
| Hispanics or Latinos | 0.0 /100 | #320 | Tragic $35,688 |
| Blacks/African Americans | 0.0 /100 | #321 | Tragic $35,564 |
| Creek | 0.0 /100 | #322 | Tragic $35,546 |
| Cheyenne | 0.0 /100 | #323 | Tragic $35,276 |
| Kiowa | 0.0 /100 | #324 | Tragic $35,102 |
| Immigrants | Central America | 0.0 /100 | #325 | Tragic $34,974 |
| Immigrants | Cuba | 0.0 /100 | #326 | Tragic $34,910 |
| Apache | 0.0 /100 | #327 | Tragic $34,886 |
| Menominee | 0.0 /100 | #328 | Tragic $34,578 |
| Mexicans | 0.0 /100 | #329 | Tragic $34,559 |
| Spanish American Indians | 0.0 /100 | #330 | Tragic $34,195 |
Demographics Similar to Immigrants from Eastern Europe by Per Capita Income
In terms of per capita income, the demographic groups most similar to Immigrants from Eastern Europe are Greek ($49,309, a difference of 0.010%), Immigrants from Hungary ($49,303, a difference of 0.030%), Immigrants from North America ($49,302, a difference of 0.030%), Immigrants from Canada ($49,412, a difference of 0.20%), and Lithuanian ($49,448, a difference of 0.27%).
| Demographics | Rating | Rank | Per Capita Income |
| Maltese | 99.9 /100 | #63 | Exceptional $49,640 |
| Immigrants | Argentina | 99.9 /100 | #64 | Exceptional $49,627 |
| Bolivians | 99.9 /100 | #65 | Exceptional $49,526 |
| Immigrants | Bulgaria | 99.9 /100 | #66 | Exceptional $49,482 |
| Immigrants | Romania | 99.9 /100 | #67 | Exceptional $49,463 |
| Lithuanians | 99.8 /100 | #68 | Exceptional $49,448 |
| Immigrants | Canada | 99.8 /100 | #69 | Exceptional $49,412 |
| Immigrants | Eastern Europe | 99.8 /100 | #70 | Exceptional $49,316 |
| Greeks | 99.8 /100 | #71 | Exceptional $49,309 |
| Immigrants | Hungary | 99.8 /100 | #72 | Exceptional $49,303 |
| Immigrants | North America | 99.8 /100 | #73 | Exceptional $49,302 |
| Mongolians | 99.8 /100 | #74 | Exceptional $49,173 |
| Immigrants | Bolivia | 99.7 /100 | #75 | Exceptional $48,970 |
| Immigrants | England | 99.7 /100 | #76 | Exceptional $48,844 |
| Immigrants | Kazakhstan | 99.7 /100 | #77 | Exceptional $48,747 |