Cheyenne vs Czechoslovakian Per Capita Income
COMPARE
Cheyenne
Czechoslovakian
Per Capita Income
Per Capita Income Comparison
Cheyenne
Czechoslovakians
$35,276
PER CAPITA INCOME
0.0/ 100
METRIC RATING
323rd/ 347
METRIC RANK
$43,806
PER CAPITA INCOME
54.1/ 100
METRIC RATING
172nd/ 347
METRIC RANK
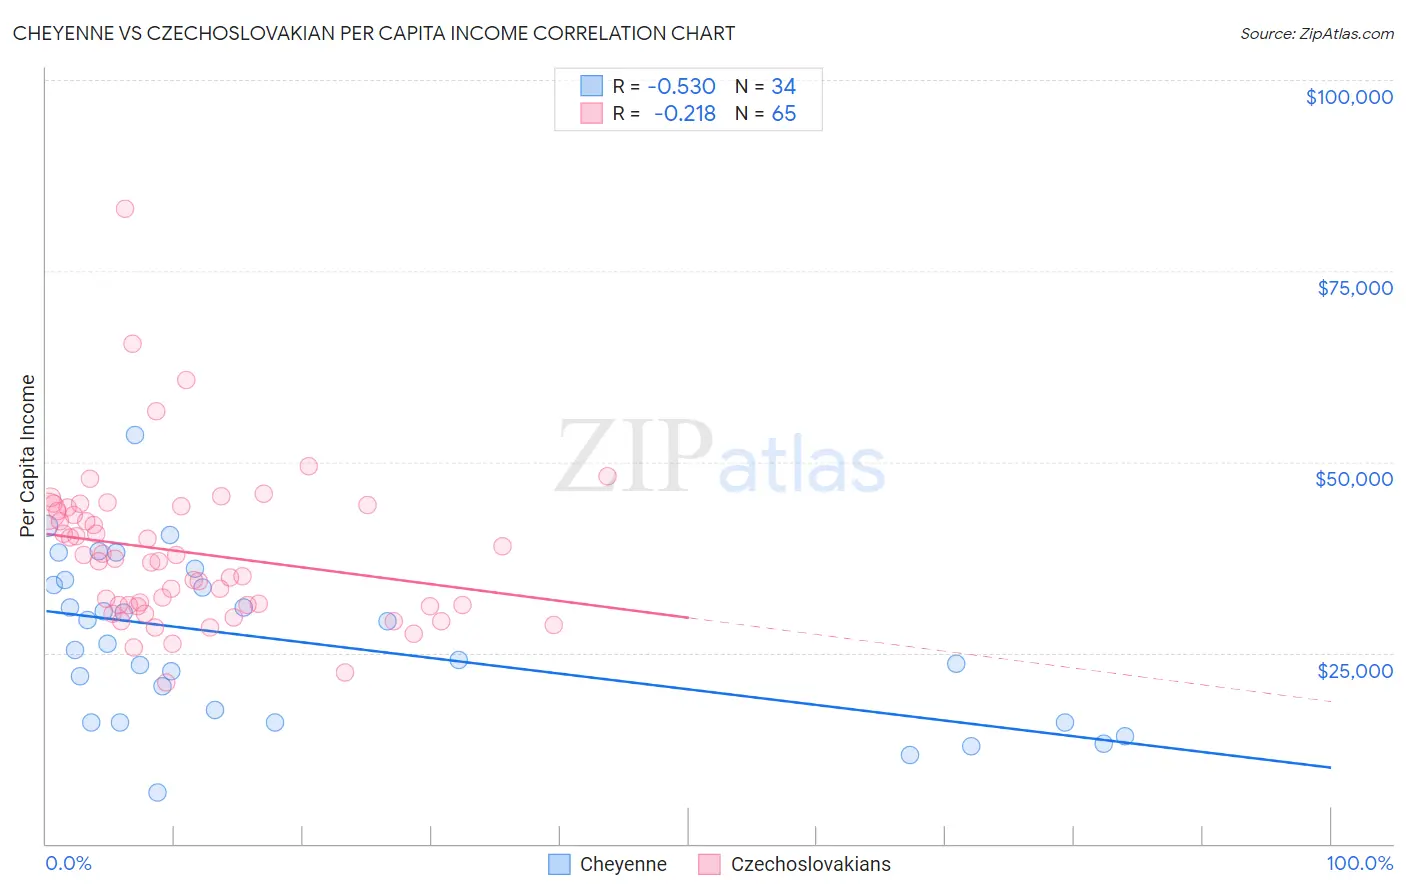
Cheyenne vs Czechoslovakian Per Capita Income Correlation Chart
The statistical analysis conducted on geographies consisting of 80,722,590 people shows a substantial negative correlation between the proportion of Cheyenne and per capita income in the United States with a correlation coefficient (R) of -0.530 and weighted average of $35,276. Similarly, the statistical analysis conducted on geographies consisting of 368,679,879 people shows a weak negative correlation between the proportion of Czechoslovakians and per capita income in the United States with a correlation coefficient (R) of -0.218 and weighted average of $43,806, a difference of 24.2%.
Per Capita Income Correlation Summary
| Measurement | Cheyenne | Czechoslovakian |
| Minimum | $6,772 | $21,167 |
| Maximum | $53,471 | $83,138 |
| Range | $46,699 | $61,971 |
| Mean | $26,352 | $38,118 |
| Median | $25,776 | $36,952 |
| Interquartile 25% (IQ1) | $15,918 | $31,180 |
| Interquartile 75% (IQ3) | $33,955 | $43,747 |
| Interquartile Range (IQR) | $18,037 | $12,567 |
| Standard Deviation (Sample) | $10,544 | $10,239 |
| Standard Deviation (Population) | $10,388 | $10,160 |
Similar Demographics by Per Capita Income
Demographics Similar to Cheyenne by Per Capita Income
In terms of per capita income, the demographic groups most similar to Cheyenne are Kiowa ($35,102, a difference of 0.50%), Creek ($35,546, a difference of 0.76%), Black/African American ($35,564, a difference of 0.82%), Immigrants from Central America ($34,974, a difference of 0.87%), and Immigrants from Cuba ($34,910, a difference of 1.1%).
| Demographics | Rating | Rank | Per Capita Income |
| Choctaw | 0.0 /100 | #316 | Tragic $35,999 |
| Dutch West Indians | 0.0 /100 | #317 | Tragic $35,922 |
| Bangladeshis | 0.0 /100 | #318 | Tragic $35,897 |
| Immigrants | Congo | 0.0 /100 | #319 | Tragic $35,720 |
| Hispanics or Latinos | 0.0 /100 | #320 | Tragic $35,688 |
| Blacks/African Americans | 0.0 /100 | #321 | Tragic $35,564 |
| Creek | 0.0 /100 | #322 | Tragic $35,546 |
| Cheyenne | 0.0 /100 | #323 | Tragic $35,276 |
| Kiowa | 0.0 /100 | #324 | Tragic $35,102 |
| Immigrants | Central America | 0.0 /100 | #325 | Tragic $34,974 |
| Immigrants | Cuba | 0.0 /100 | #326 | Tragic $34,910 |
| Apache | 0.0 /100 | #327 | Tragic $34,886 |
| Menominee | 0.0 /100 | #328 | Tragic $34,578 |
| Mexicans | 0.0 /100 | #329 | Tragic $34,559 |
| Spanish American Indians | 0.0 /100 | #330 | Tragic $34,195 |
Demographics Similar to Czechoslovakians by Per Capita Income
In terms of per capita income, the demographic groups most similar to Czechoslovakians are Immigrants from Eastern Africa ($43,838, a difference of 0.070%), Scandinavian ($43,848, a difference of 0.090%), Immigrants from Peru ($43,852, a difference of 0.11%), French ($43,685, a difference of 0.28%), and Belgian ($43,951, a difference of 0.33%).
| Demographics | Rating | Rank | Per Capita Income |
| Immigrants | Philippines | 59.4 /100 | #165 | Average $44,000 |
| Immigrants | Uruguay | 59.3 /100 | #166 | Average $43,997 |
| English | 58.9 /100 | #167 | Average $43,982 |
| Belgians | 58.1 /100 | #168 | Average $43,951 |
| Immigrants | Peru | 55.3 /100 | #169 | Average $43,852 |
| Scandinavians | 55.2 /100 | #170 | Average $43,848 |
| Immigrants | Eastern Africa | 54.9 /100 | #171 | Average $43,838 |
| Czechoslovakians | 54.1 /100 | #172 | Average $43,806 |
| French | 50.7 /100 | #173 | Average $43,685 |
| Colombians | 50.0 /100 | #174 | Average $43,661 |
| Celtics | 48.9 /100 | #175 | Average $43,621 |
| Immigrants | South Eastern Asia | 46.6 /100 | #176 | Average $43,539 |
| Tlingit-Haida | 45.9 /100 | #177 | Average $43,516 |
| Immigrants | Costa Rica | 44.5 /100 | #178 | Average $43,464 |
| Finns | 44.4 /100 | #179 | Average $43,461 |