Celtic vs Immigrants from Somalia Nursery School
COMPARE
Celtic
Immigrants from Somalia
Nursery School
Nursery School Comparison
Celtics
Immigrants from Somalia
98.5%
NURSERY SCHOOL
99.8/ 100
METRIC RATING
50th/ 347
METRIC RANK
97.0%
NURSERY SCHOOL
0.0/ 100
METRIC RATING
309th/ 347
METRIC RANK
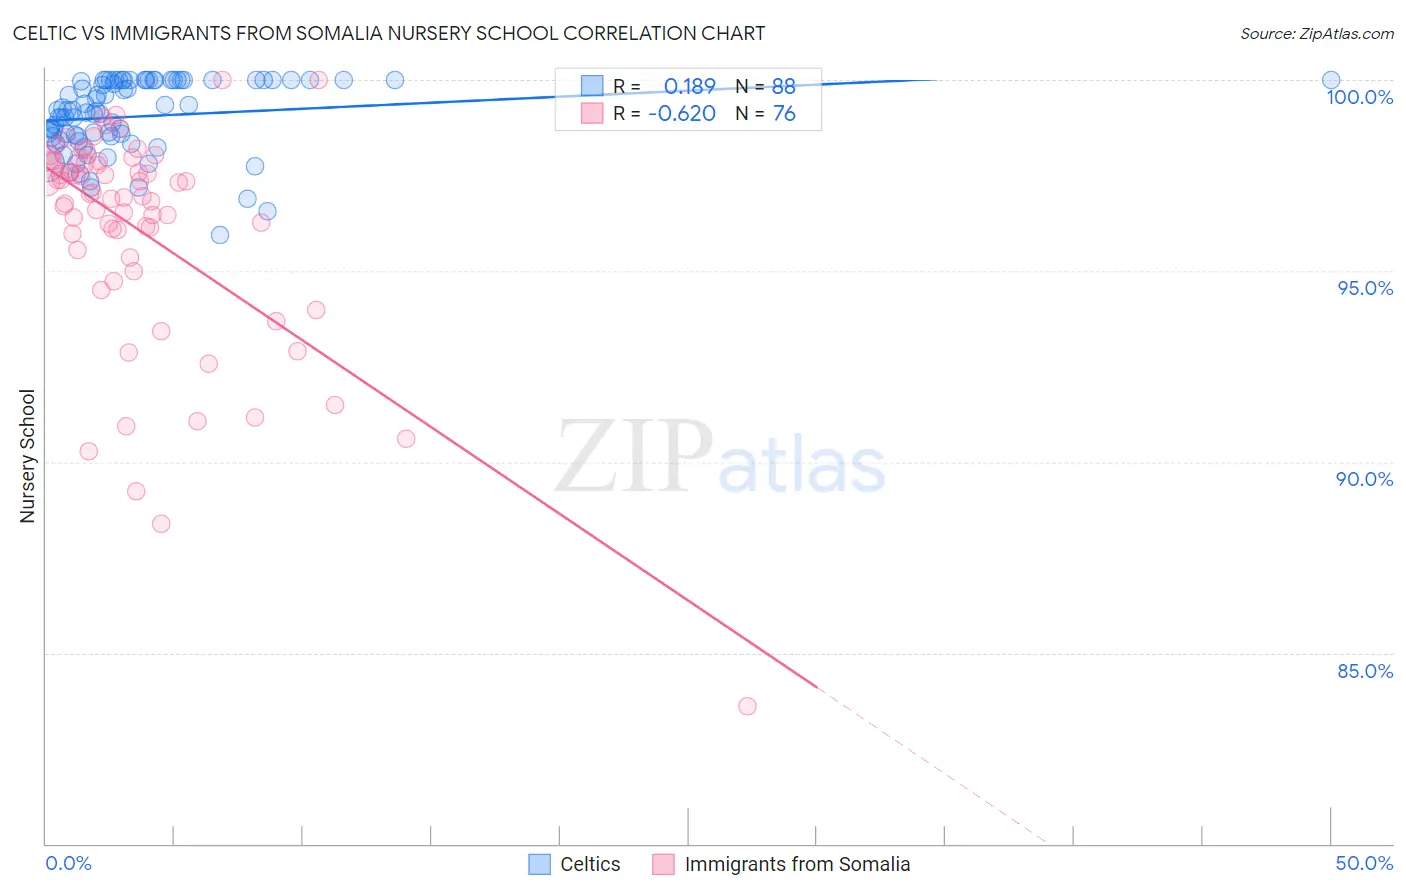
Celtic vs Immigrants from Somalia Nursery School Correlation Chart
The statistical analysis conducted on geographies consisting of 168,875,705 people shows a poor positive correlation between the proportion of Celtics and percentage of population with at least nursery school education in the United States with a correlation coefficient (R) of 0.189 and weighted average of 98.5%. Similarly, the statistical analysis conducted on geographies consisting of 92,111,755 people shows a significant negative correlation between the proportion of Immigrants from Somalia and percentage of population with at least nursery school education in the United States with a correlation coefficient (R) of -0.620 and weighted average of 97.0%, a difference of 1.5%.
Nursery School Correlation Summary
| Measurement | Celtic | Immigrants from Somalia |
| Minimum | 95.9% | 83.6% |
| Maximum | 100.0% | 100.0% |
| Range | 4.1% | 16.4% |
| Mean | 99.0% | 96.1% |
| Median | 99.2% | 97.0% |
| Interquartile 25% (IQ1) | 98.5% | 95.5% |
| Interquartile 75% (IQ3) | 100.0% | 97.9% |
| Interquartile Range (IQR) | 1.5% | 2.4% |
| Standard Deviation (Sample) | 0.96% | 2.9% |
| Standard Deviation (Population) | 0.95% | 2.9% |
Similar Demographics by Nursery School
Demographics Similar to Celtics by Nursery School
In terms of nursery school, the demographic groups most similar to Celtics are Ottawa (98.5%, a difference of 0.0%), White/Caucasian (98.5%, a difference of 0.0%), Estonian (98.5%, a difference of 0.0%), Australian (98.5%, a difference of 0.0%), and Czechoslovakian (98.5%, a difference of 0.010%).
| Demographics | Rating | Rank | Nursery School |
| Native Hawaiians | 99.9 /100 | #43 | Exceptional 98.5% |
| Belgians | 99.9 /100 | #44 | Exceptional 98.5% |
| Northern Europeans | 99.9 /100 | #45 | Exceptional 98.5% |
| Hungarians | 99.9 /100 | #46 | Exceptional 98.5% |
| Czechoslovakians | 99.9 /100 | #47 | Exceptional 98.5% |
| Ottawa | 99.8 /100 | #48 | Exceptional 98.5% |
| Whites/Caucasians | 99.8 /100 | #49 | Exceptional 98.5% |
| Celtics | 99.8 /100 | #50 | Exceptional 98.5% |
| Estonians | 99.8 /100 | #51 | Exceptional 98.5% |
| Australians | 99.8 /100 | #52 | Exceptional 98.5% |
| Kiowa | 99.8 /100 | #53 | Exceptional 98.4% |
| Pueblo | 99.8 /100 | #54 | Exceptional 98.4% |
| Immigrants | Scotland | 99.8 /100 | #55 | Exceptional 98.4% |
| Americans | 99.8 /100 | #56 | Exceptional 98.4% |
| Austrians | 99.8 /100 | #57 | Exceptional 98.4% |
Demographics Similar to Immigrants from Somalia by Nursery School
In terms of nursery school, the demographic groups most similar to Immigrants from Somalia are Hispanic or Latino (97.0%, a difference of 0.010%), Immigrants from Haiti (97.0%, a difference of 0.010%), Guyanese (97.0%, a difference of 0.010%), Immigrants from the Azores (97.0%, a difference of 0.010%), and Sri Lankan (97.0%, a difference of 0.010%).
| Demographics | Rating | Rank | Nursery School |
| Immigrants | Caribbean | 0.0 /100 | #302 | Tragic 97.1% |
| Nicaraguans | 0.0 /100 | #303 | Tragic 97.1% |
| Ecuadorians | 0.0 /100 | #304 | Tragic 97.1% |
| Somalis | 0.0 /100 | #305 | Tragic 97.1% |
| Belizeans | 0.0 /100 | #306 | Tragic 97.0% |
| Hispanics or Latinos | 0.0 /100 | #307 | Tragic 97.0% |
| Immigrants | Haiti | 0.0 /100 | #308 | Tragic 97.0% |
| Immigrants | Somalia | 0.0 /100 | #309 | Tragic 97.0% |
| Guyanese | 0.0 /100 | #310 | Tragic 97.0% |
| Immigrants | Azores | 0.0 /100 | #311 | Tragic 97.0% |
| Sri Lankans | 0.0 /100 | #312 | Tragic 97.0% |
| Hondurans | 0.0 /100 | #313 | Tragic 97.0% |
| Cape Verdeans | 0.0 /100 | #314 | Tragic 97.0% |
| Immigrants | Nicaragua | 0.0 /100 | #315 | Tragic 96.9% |
| Immigrants | Belize | 0.0 /100 | #316 | Tragic 96.9% |