Celtic vs African Median Household Income
COMPARE
Celtic
African
Median Household Income
Median Household Income Comparison
Celtics
Africans
$83,193
MEDIAN HOUSEHOLD INCOME
22.7/ 100
METRIC RATING
205th/ 347
METRIC RANK
$72,650
MEDIAN HOUSEHOLD INCOME
0.0/ 100
METRIC RATING
303rd/ 347
METRIC RANK
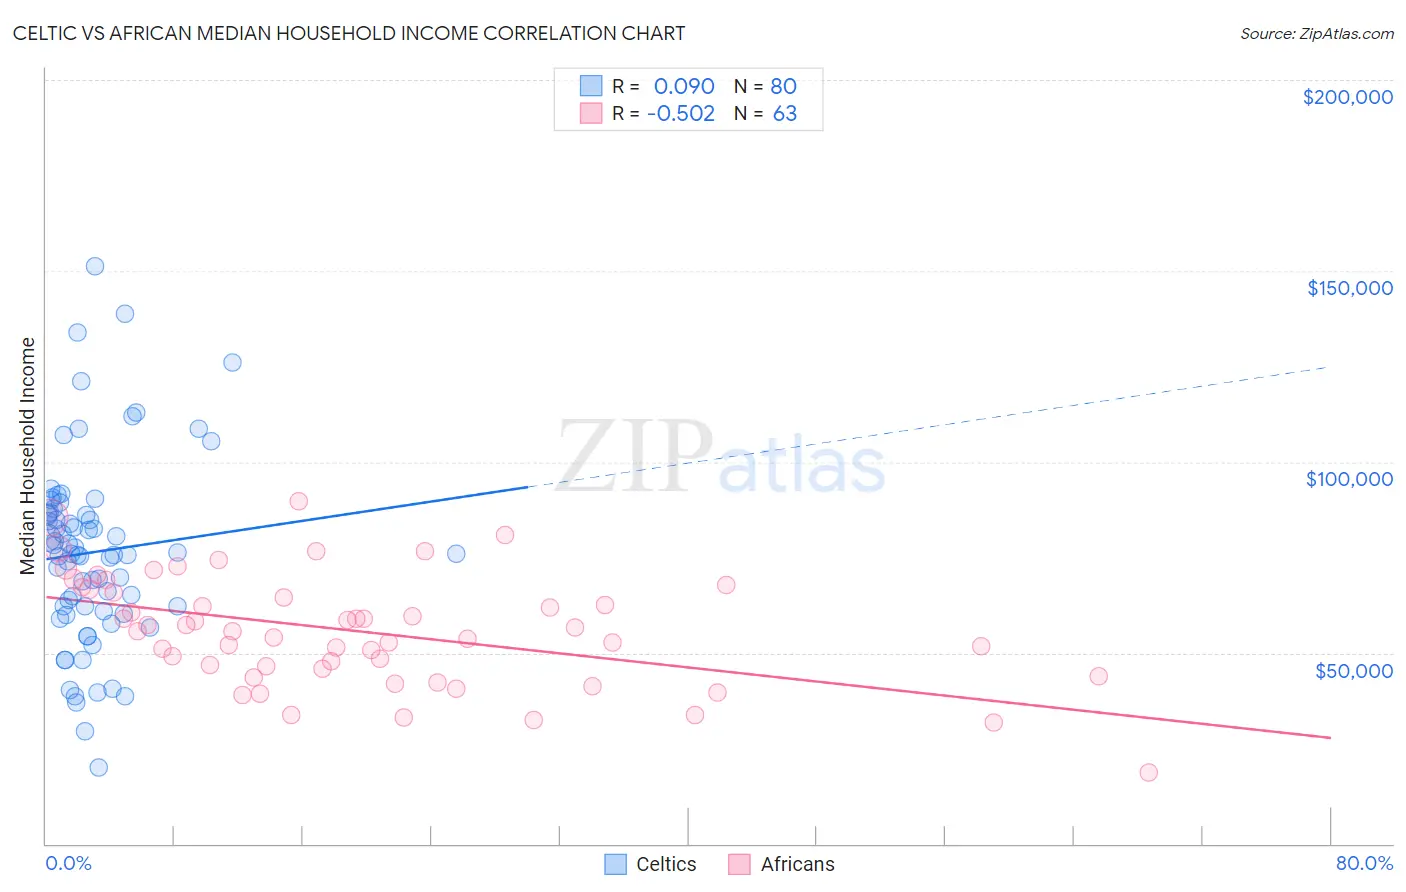
Celtic vs African Median Household Income Correlation Chart
The statistical analysis conducted on geographies consisting of 168,842,689 people shows a slight positive correlation between the proportion of Celtics and median household income in the United States with a correlation coefficient (R) of 0.090 and weighted average of $83,193. Similarly, the statistical analysis conducted on geographies consisting of 469,417,783 people shows a substantial negative correlation between the proportion of Africans and median household income in the United States with a correlation coefficient (R) of -0.502 and weighted average of $72,650, a difference of 14.5%.
Median Household Income Correlation Summary
| Measurement | Celtic | African |
| Minimum | $19,921 | $18,750 |
| Maximum | $151,161 | $89,652 |
| Range | $131,240 | $70,902 |
| Mean | $76,393 | $55,711 |
| Median | $75,866 | $55,621 |
| Interquartile 25% (IQ1) | $61,507 | $45,960 |
| Interquartile 75% (IQ3) | $86,536 | $66,633 |
| Interquartile Range (IQR) | $25,028 | $20,673 |
| Standard Deviation (Sample) | $24,415 | $14,453 |
| Standard Deviation (Population) | $24,262 | $14,338 |
Similar Demographics by Median Household Income
Demographics Similar to Celtics by Median Household Income
In terms of median household income, the demographic groups most similar to Celtics are Immigrants from Africa ($83,289, a difference of 0.11%), Immigrants from Cambodia ($83,304, a difference of 0.13%), Immigrants from Kenya ($83,068, a difference of 0.15%), Immigrants from Thailand ($83,327, a difference of 0.16%), and Tsimshian ($83,346, a difference of 0.18%).
| Demographics | Rating | Rank | Median Household Income |
| Japanese | 25.1 /100 | #198 | Fair $83,395 |
| Germans | 24.6 /100 | #199 | Fair $83,358 |
| Tsimshian | 24.5 /100 | #200 | Fair $83,346 |
| Spanish | 24.4 /100 | #201 | Fair $83,343 |
| Immigrants | Thailand | 24.3 /100 | #202 | Fair $83,327 |
| Immigrants | Cambodia | 24.0 /100 | #203 | Fair $83,304 |
| Immigrants | Africa | 23.8 /100 | #204 | Fair $83,289 |
| Celtics | 22.7 /100 | #205 | Fair $83,193 |
| Immigrants | Kenya | 21.3 /100 | #206 | Fair $83,068 |
| Dutch | 20.3 /100 | #207 | Fair $82,971 |
| French Canadians | 18.7 /100 | #208 | Poor $82,810 |
| Immigrants | Iraq | 16.7 /100 | #209 | Poor $82,594 |
| Immigrants | Uruguay | 16.4 /100 | #210 | Poor $82,560 |
| Salvadorans | 15.4 /100 | #211 | Poor $82,449 |
| Venezuelans | 15.3 /100 | #212 | Poor $82,432 |
Demographics Similar to Africans by Median Household Income
In terms of median household income, the demographic groups most similar to Africans are Shoshone ($72,660, a difference of 0.010%), Cherokee ($72,682, a difference of 0.040%), Immigrants from Haiti ($72,599, a difference of 0.070%), Honduran ($72,588, a difference of 0.090%), and Potawatomi ($72,576, a difference of 0.10%).
| Demographics | Rating | Rank | Median Household Income |
| Haitians | 0.1 /100 | #296 | Tragic $73,306 |
| Immigrants | Mexico | 0.0 /100 | #297 | Tragic $73,160 |
| Paiute | 0.0 /100 | #298 | Tragic $72,959 |
| Indonesians | 0.0 /100 | #299 | Tragic $72,856 |
| Immigrants | Dominica | 0.0 /100 | #300 | Tragic $72,760 |
| Cherokee | 0.0 /100 | #301 | Tragic $72,682 |
| Shoshone | 0.0 /100 | #302 | Tragic $72,660 |
| Africans | 0.0 /100 | #303 | Tragic $72,650 |
| Immigrants | Haiti | 0.0 /100 | #304 | Tragic $72,599 |
| Hondurans | 0.0 /100 | #305 | Tragic $72,588 |
| Potawatomi | 0.0 /100 | #306 | Tragic $72,576 |
| Ute | 0.0 /100 | #307 | Tragic $72,402 |
| Yakama | 0.0 /100 | #308 | Tragic $72,225 |
| Immigrants | Caribbean | 0.0 /100 | #309 | Tragic $71,860 |
| U.S. Virgin Islanders | 0.0 /100 | #310 | Tragic $71,853 |