Celtic vs Asian Median Household Income
COMPARE
Celtic
Asian
Median Household Income
Median Household Income Comparison
Celtics
Asians
$83,193
MEDIAN HOUSEHOLD INCOME
22.7/ 100
METRIC RATING
205th/ 347
METRIC RANK
$101,681
MEDIAN HOUSEHOLD INCOME
100.0/ 100
METRIC RATING
22nd/ 347
METRIC RANK
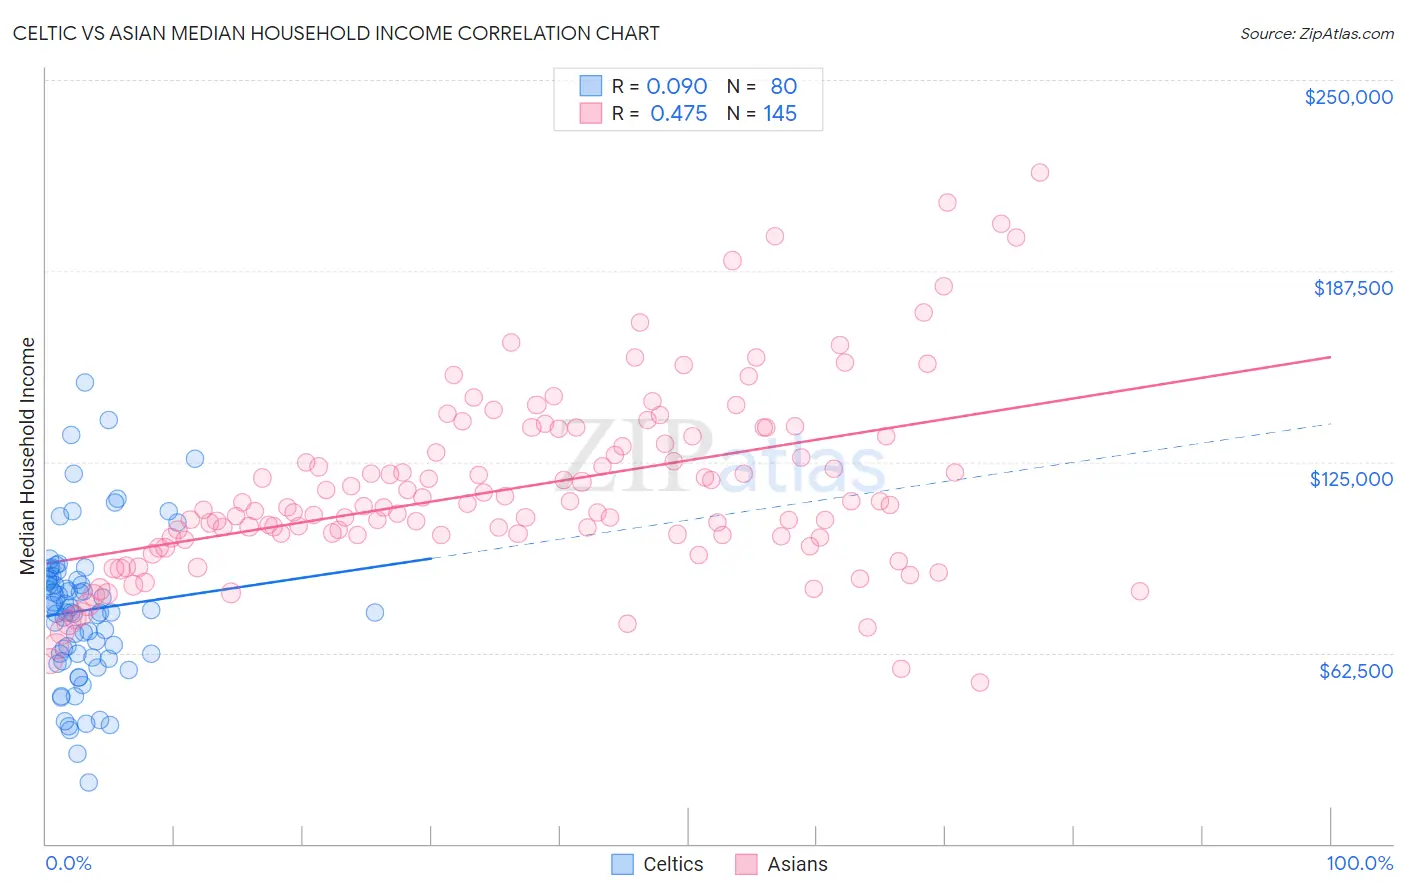
Celtic vs Asian Median Household Income Correlation Chart
The statistical analysis conducted on geographies consisting of 168,842,689 people shows a slight positive correlation between the proportion of Celtics and median household income in the United States with a correlation coefficient (R) of 0.090 and weighted average of $83,193. Similarly, the statistical analysis conducted on geographies consisting of 549,980,753 people shows a moderate positive correlation between the proportion of Asians and median household income in the United States with a correlation coefficient (R) of 0.475 and weighted average of $101,681, a difference of 22.2%.
Median Household Income Correlation Summary
| Measurement | Celtic | Asian |
| Minimum | $19,921 | $52,658 |
| Maximum | $151,161 | $219,913 |
| Range | $131,240 | $167,255 |
| Mean | $76,393 | $116,419 |
| Median | $75,866 | $110,126 |
| Interquartile 25% (IQ1) | $61,507 | $100,433 |
| Interquartile 75% (IQ3) | $86,536 | $133,482 |
| Interquartile Range (IQR) | $25,028 | $33,049 |
| Standard Deviation (Sample) | $24,415 | $30,496 |
| Standard Deviation (Population) | $24,262 | $30,391 |
Similar Demographics by Median Household Income
Demographics Similar to Celtics by Median Household Income
In terms of median household income, the demographic groups most similar to Celtics are Immigrants from Africa ($83,289, a difference of 0.11%), Immigrants from Cambodia ($83,304, a difference of 0.13%), Immigrants from Kenya ($83,068, a difference of 0.15%), Immigrants from Thailand ($83,327, a difference of 0.16%), and Tsimshian ($83,346, a difference of 0.18%).
| Demographics | Rating | Rank | Median Household Income |
| Japanese | 25.1 /100 | #198 | Fair $83,395 |
| Germans | 24.6 /100 | #199 | Fair $83,358 |
| Tsimshian | 24.5 /100 | #200 | Fair $83,346 |
| Spanish | 24.4 /100 | #201 | Fair $83,343 |
| Immigrants | Thailand | 24.3 /100 | #202 | Fair $83,327 |
| Immigrants | Cambodia | 24.0 /100 | #203 | Fair $83,304 |
| Immigrants | Africa | 23.8 /100 | #204 | Fair $83,289 |
| Celtics | 22.7 /100 | #205 | Fair $83,193 |
| Immigrants | Kenya | 21.3 /100 | #206 | Fair $83,068 |
| Dutch | 20.3 /100 | #207 | Fair $82,971 |
| French Canadians | 18.7 /100 | #208 | Poor $82,810 |
| Immigrants | Iraq | 16.7 /100 | #209 | Poor $82,594 |
| Immigrants | Uruguay | 16.4 /100 | #210 | Poor $82,560 |
| Salvadorans | 15.4 /100 | #211 | Poor $82,449 |
| Venezuelans | 15.3 /100 | #212 | Poor $82,432 |
Demographics Similar to Asians by Median Household Income
In terms of median household income, the demographic groups most similar to Asians are Eastern European ($101,781, a difference of 0.10%), Immigrants from Bolivia ($101,394, a difference of 0.28%), Bolivian ($102,195, a difference of 0.50%), Immigrants from Australia ($102,562, a difference of 0.87%), and Immigrants from Japan ($100,711, a difference of 0.96%).
| Demographics | Rating | Rank | Median Household Income |
| Immigrants | Israel | 100.0 /100 | #15 | Exceptional $104,090 |
| Burmese | 100.0 /100 | #16 | Exceptional $103,145 |
| Immigrants | Korea | 100.0 /100 | #17 | Exceptional $102,962 |
| Cypriots | 100.0 /100 | #18 | Exceptional $102,843 |
| Immigrants | Australia | 100.0 /100 | #19 | Exceptional $102,562 |
| Bolivians | 100.0 /100 | #20 | Exceptional $102,195 |
| Eastern Europeans | 100.0 /100 | #21 | Exceptional $101,781 |
| Asians | 100.0 /100 | #22 | Exceptional $101,681 |
| Immigrants | Bolivia | 100.0 /100 | #23 | Exceptional $101,394 |
| Immigrants | Japan | 100.0 /100 | #24 | Exceptional $100,711 |
| Immigrants | Sweden | 100.0 /100 | #25 | Exceptional $100,699 |
| Immigrants | Belgium | 100.0 /100 | #26 | Exceptional $100,306 |
| Bhutanese | 100.0 /100 | #27 | Exceptional $100,151 |
| Immigrants | Sri Lanka | 100.0 /100 | #28 | Exceptional $99,943 |
| Immigrants | Asia | 100.0 /100 | #29 | Exceptional $99,933 |