Cambodian vs Immigrants from Portugal Female Unemployment
COMPARE
Cambodian
Immigrants from Portugal
Female Unemployment
Female Unemployment Comparison
Cambodians
Immigrants from Portugal
4.9%
FEMALE UNEMPLOYMENT
99.1/ 100
METRIC RATING
51st/ 347
METRIC RANK
5.8%
FEMALE UNEMPLOYMENT
0.2/ 100
METRIC RATING
258th/ 347
METRIC RANK
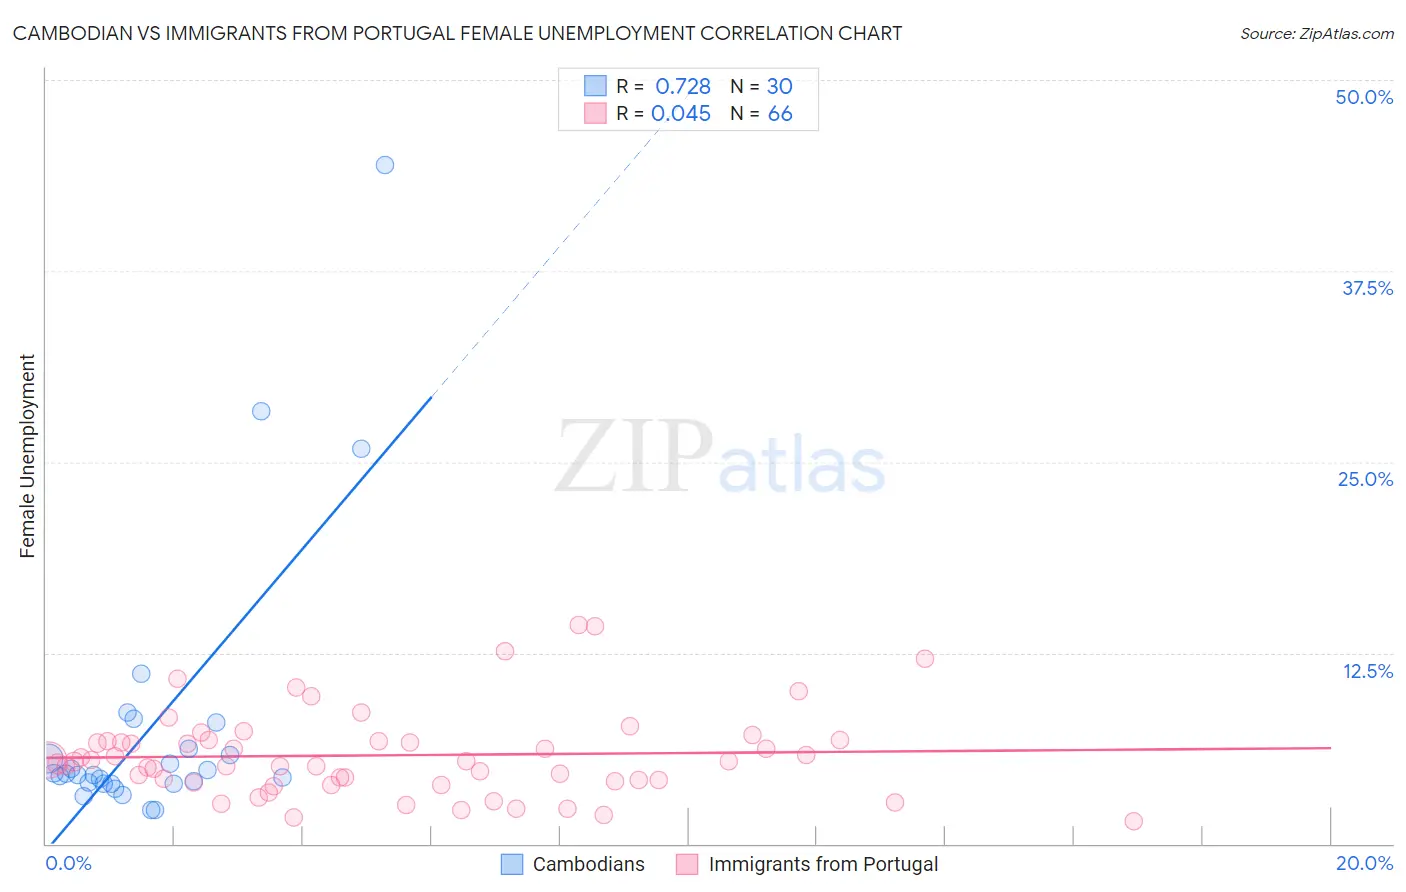
Cambodian vs Immigrants from Portugal Female Unemployment Correlation Chart
The statistical analysis conducted on geographies consisting of 102,438,454 people shows a strong positive correlation between the proportion of Cambodians and unemploymnet rate among females in the United States with a correlation coefficient (R) of 0.728 and weighted average of 4.9%. Similarly, the statistical analysis conducted on geographies consisting of 174,363,409 people shows no correlation between the proportion of Immigrants from Portugal and unemploymnet rate among females in the United States with a correlation coefficient (R) of 0.045 and weighted average of 5.8%, a difference of 17.6%.
Female Unemployment Correlation Summary
| Measurement | Cambodian | Immigrants from Portugal |
| Minimum | 2.2% | 1.5% |
| Maximum | 44.4% | 14.3% |
| Range | 42.2% | 12.8% |
| Mean | 7.7% | 5.8% |
| Median | 4.5% | 5.4% |
| Interquartile 25% (IQ1) | 4.0% | 4.1% |
| Interquartile 75% (IQ3) | 6.2% | 6.7% |
| Interquartile Range (IQR) | 2.2% | 2.7% |
| Standard Deviation (Sample) | 9.1% | 2.8% |
| Standard Deviation (Population) | 9.0% | 2.8% |
Similar Demographics by Female Unemployment
Demographics Similar to Cambodians by Female Unemployment
In terms of female unemployment, the demographic groups most similar to Cambodians are Immigrants from Cuba (4.9%, a difference of 0.020%), Slavic (4.9%, a difference of 0.020%), White/Caucasian (4.9%, a difference of 0.050%), Immigrants from Zimbabwe (4.9%, a difference of 0.11%), and Immigrants from Moldova (4.9%, a difference of 0.12%).
| Demographics | Rating | Rank | Female Unemployment |
| Greeks | 99.4 /100 | #44 | Exceptional 4.9% |
| Austrians | 99.3 /100 | #45 | Exceptional 4.9% |
| Immigrants | Bulgaria | 99.3 /100 | #46 | Exceptional 4.9% |
| Okinawans | 99.3 /100 | #47 | Exceptional 4.9% |
| Thais | 99.2 /100 | #48 | Exceptional 4.9% |
| Australians | 99.2 /100 | #49 | Exceptional 4.9% |
| Immigrants | Cuba | 99.1 /100 | #50 | Exceptional 4.9% |
| Cambodians | 99.1 /100 | #51 | Exceptional 4.9% |
| Slavs | 99.1 /100 | #52 | Exceptional 4.9% |
| Whites/Caucasians | 99.0 /100 | #53 | Exceptional 4.9% |
| Immigrants | Zimbabwe | 99.0 /100 | #54 | Exceptional 4.9% |
| Immigrants | Moldova | 99.0 /100 | #55 | Exceptional 4.9% |
| Serbians | 99.0 /100 | #56 | Exceptional 4.9% |
| Icelanders | 98.8 /100 | #57 | Exceptional 4.9% |
| Immigrants | Lithuania | 98.8 /100 | #58 | Exceptional 4.9% |
Demographics Similar to Immigrants from Portugal by Female Unemployment
In terms of female unemployment, the demographic groups most similar to Immigrants from Portugal are Immigrants from Fiji (5.8%, a difference of 0.11%), Nigerian (5.8%, a difference of 0.14%), Kiowa (5.8%, a difference of 0.41%), Immigrants from Nigeria (5.8%, a difference of 0.44%), and Dutch West Indian (5.7%, a difference of 0.81%).
| Demographics | Rating | Rank | Female Unemployment |
| Assyrians/Chaldeans/Syriacs | 0.8 /100 | #251 | Tragic 5.6% |
| Cajuns | 0.7 /100 | #252 | Tragic 5.7% |
| Immigrants | Sierra Leone | 0.6 /100 | #253 | Tragic 5.7% |
| Immigrants | Immigrants | 0.6 /100 | #254 | Tragic 5.7% |
| Immigrants | Cameroon | 0.6 /100 | #255 | Tragic 5.7% |
| Sub-Saharan Africans | 0.4 /100 | #256 | Tragic 5.7% |
| Dutch West Indians | 0.3 /100 | #257 | Tragic 5.7% |
| Immigrants | Portugal | 0.2 /100 | #258 | Tragic 5.8% |
| Immigrants | Fiji | 0.2 /100 | #259 | Tragic 5.8% |
| Nigerians | 0.2 /100 | #260 | Tragic 5.8% |
| Kiowa | 0.1 /100 | #261 | Tragic 5.8% |
| Immigrants | Nigeria | 0.1 /100 | #262 | Tragic 5.8% |
| Immigrants | Azores | 0.1 /100 | #263 | Tragic 5.8% |
| Immigrants | Bahamas | 0.1 /100 | #264 | Tragic 5.8% |
| Blackfeet | 0.0 /100 | #265 | Tragic 5.9% |