Cambodian vs Immigrants from Portugal Householder Income Under 25 years
COMPARE
Cambodian
Immigrants from Portugal
Householder Income Under 25 years
Householder Income Under 25 years Comparison
Cambodians
Immigrants from Portugal
$55,571
HOUSEHOLDER INCOME UNDER 25 YEARS
100.0/ 100
METRIC RATING
47th/ 347
METRIC RANK
$54,105
HOUSEHOLDER INCOME UNDER 25 YEARS
99.1/ 100
METRIC RATING
97th/ 347
METRIC RANK
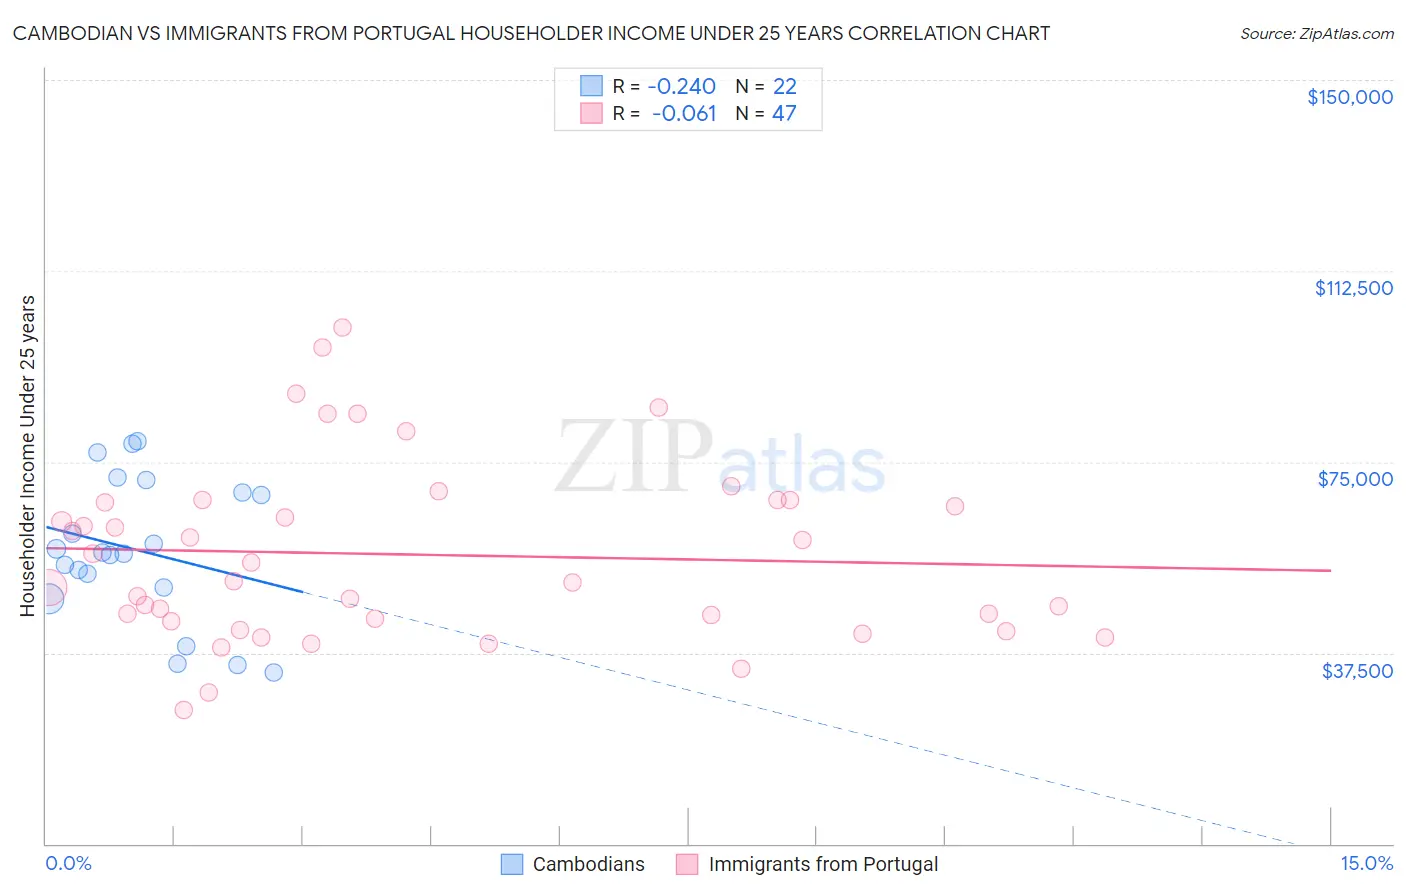
Cambodian vs Immigrants from Portugal Householder Income Under 25 years Correlation Chart
The statistical analysis conducted on geographies consisting of 96,374,158 people shows a weak negative correlation between the proportion of Cambodians and household income with householder under the age of 25 in the United States with a correlation coefficient (R) of -0.240 and weighted average of $55,571. Similarly, the statistical analysis conducted on geographies consisting of 149,512,592 people shows a slight negative correlation between the proportion of Immigrants from Portugal and household income with householder under the age of 25 in the United States with a correlation coefficient (R) of -0.061 and weighted average of $54,105, a difference of 2.7%.
Householder Income Under 25 years Correlation Summary
| Measurement | Cambodian | Immigrants from Portugal |
| Minimum | $33,698 | $26,161 |
| Maximum | $79,145 | $101,440 |
| Range | $45,447 | $75,279 |
| Mean | $57,571 | $56,802 |
| Median | $57,095 | $51,667 |
| Interquartile 25% (IQ1) | $50,277 | $43,800 |
| Interquartile 75% (IQ3) | $68,894 | $67,515 |
| Interquartile Range (IQR) | $18,617 | $23,715 |
| Standard Deviation (Sample) | $13,871 | $17,633 |
| Standard Deviation (Population) | $13,553 | $17,444 |
Similar Demographics by Householder Income Under 25 years
Demographics Similar to Cambodians by Householder Income Under 25 years
In terms of householder income under 25 years, the demographic groups most similar to Cambodians are Spanish American Indian ($55,573, a difference of 0.0%), Immigrants from Eastern Europe ($55,572, a difference of 0.0%), Immigrants from Vietnam ($55,562, a difference of 0.020%), Iranian ($55,548, a difference of 0.040%), and Puget Sound Salish ($55,543, a difference of 0.050%).
| Demographics | Rating | Rank | Householder Income Under 25 years |
| Immigrants | Greece | 100.0 /100 | #40 | Exceptional $55,727 |
| Immigrants | Guyana | 100.0 /100 | #41 | Exceptional $55,726 |
| Immigrants | Korea | 100.0 /100 | #42 | Exceptional $55,716 |
| Immigrants | South Eastern Asia | 100.0 /100 | #43 | Exceptional $55,714 |
| Paraguayans | 100.0 /100 | #44 | Exceptional $55,614 |
| Spanish American Indians | 100.0 /100 | #45 | Exceptional $55,573 |
| Immigrants | Eastern Europe | 100.0 /100 | #46 | Exceptional $55,572 |
| Cambodians | 100.0 /100 | #47 | Exceptional $55,571 |
| Immigrants | Vietnam | 100.0 /100 | #48 | Exceptional $55,562 |
| Iranians | 100.0 /100 | #49 | Exceptional $55,548 |
| Puget Sound Salish | 100.0 /100 | #50 | Exceptional $55,543 |
| Immigrants | Romania | 100.0 /100 | #51 | Exceptional $55,522 |
| Immigrants | Indonesia | 100.0 /100 | #52 | Exceptional $55,521 |
| Immigrants | Poland | 100.0 /100 | #53 | Exceptional $55,474 |
| Sri Lankans | 100.0 /100 | #54 | Exceptional $55,470 |
Demographics Similar to Immigrants from Portugal by Householder Income Under 25 years
In terms of householder income under 25 years, the demographic groups most similar to Immigrants from Portugal are Eastern European ($54,066, a difference of 0.070%), Argentinean ($54,154, a difference of 0.090%), Immigrants from Malaysia ($54,179, a difference of 0.14%), Immigrants from Sierra Leone ($54,190, a difference of 0.16%), and Immigrants from Argentina ($54,209, a difference of 0.19%).
| Demographics | Rating | Rank | Householder Income Under 25 years |
| Turks | 99.4 /100 | #90 | Exceptional $54,266 |
| Immigrants | Egypt | 99.3 /100 | #91 | Exceptional $54,239 |
| Immigrants | St. Vincent and the Grenadines | 99.3 /100 | #92 | Exceptional $54,230 |
| Immigrants | Argentina | 99.3 /100 | #93 | Exceptional $54,209 |
| Immigrants | Sierra Leone | 99.3 /100 | #94 | Exceptional $54,190 |
| Immigrants | Malaysia | 99.2 /100 | #95 | Exceptional $54,179 |
| Argentineans | 99.2 /100 | #96 | Exceptional $54,154 |
| Immigrants | Portugal | 99.1 /100 | #97 | Exceptional $54,105 |
| Eastern Europeans | 99.0 /100 | #98 | Exceptional $54,066 |
| Alaska Natives | 98.8 /100 | #99 | Exceptional $54,000 |
| Immigrants | Kazakhstan | 98.8 /100 | #100 | Exceptional $53,990 |
| South Americans | 98.6 /100 | #101 | Exceptional $53,939 |
| Ecuadorians | 98.5 /100 | #102 | Exceptional $53,911 |
| Ukrainians | 98.3 /100 | #103 | Exceptional $53,843 |
| Ethiopians | 98.2 /100 | #104 | Exceptional $53,818 |