Cambodian vs Immigrants from Portugal Single Father Households
COMPARE
Cambodian
Immigrants from Portugal
Single Father Households
Single Father Households Comparison
Cambodians
Immigrants from Portugal
2.0%
SINGLE FATHER HOUSEHOLDS
100.0/ 100
METRIC RATING
30th/ 347
METRIC RANK
2.6%
SINGLE FATHER HOUSEHOLDS
0.1/ 100
METRIC RATING
280th/ 347
METRIC RANK
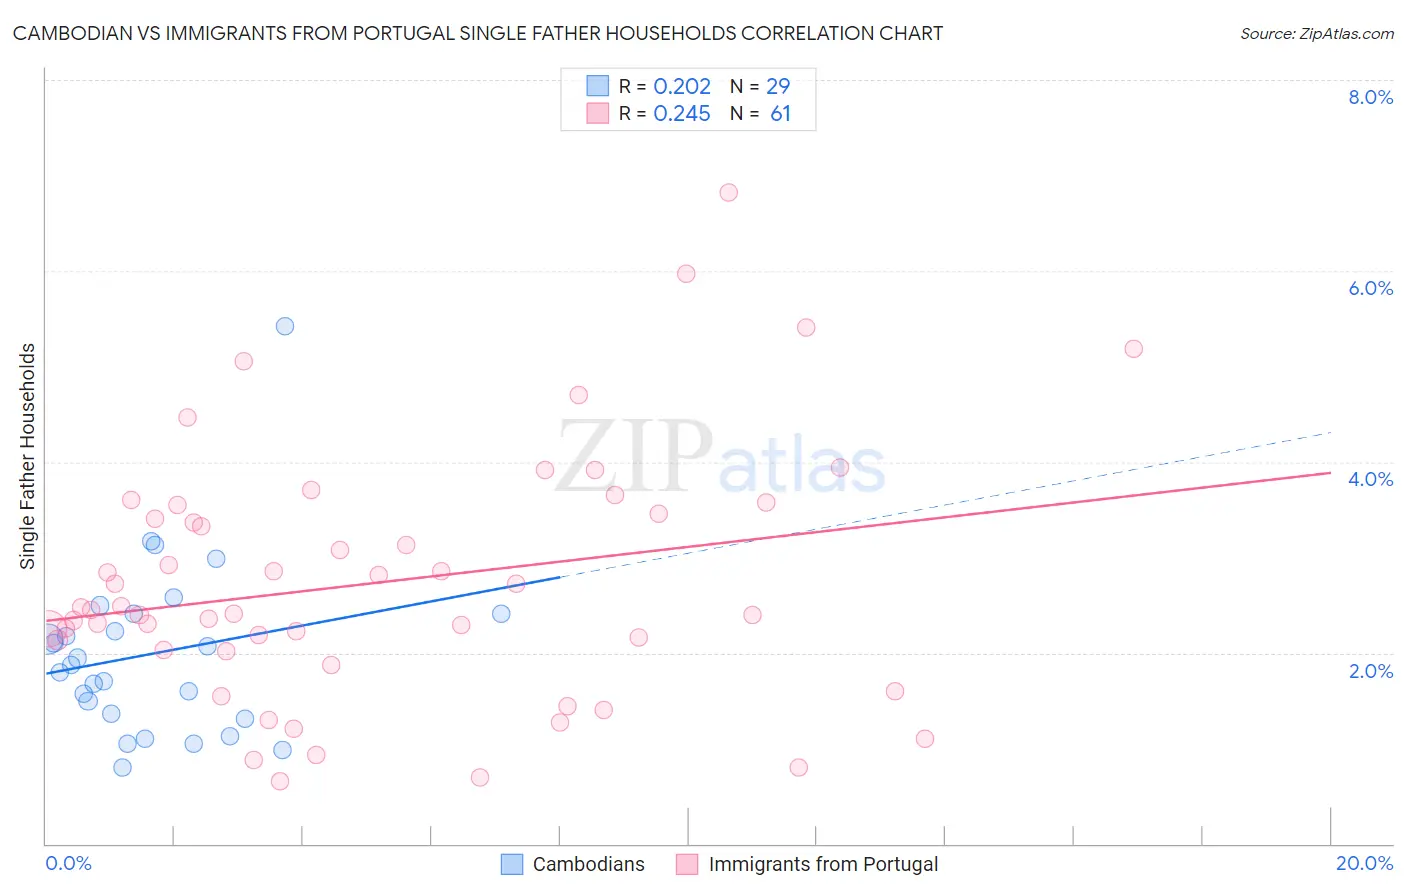
Cambodian vs Immigrants from Portugal Single Father Households Correlation Chart
The statistical analysis conducted on geographies consisting of 102,339,342 people shows a weak positive correlation between the proportion of Cambodians and percentage of single father households in the United States with a correlation coefficient (R) of 0.202 and weighted average of 2.0%. Similarly, the statistical analysis conducted on geographies consisting of 173,713,096 people shows a weak positive correlation between the proportion of Immigrants from Portugal and percentage of single father households in the United States with a correlation coefficient (R) of 0.245 and weighted average of 2.6%, a difference of 33.9%.
Single Father Households Correlation Summary
| Measurement | Cambodian | Immigrants from Portugal |
| Minimum | 0.80% | 0.66% |
| Maximum | 5.4% | 6.8% |
| Range | 4.6% | 6.2% |
| Mean | 2.0% | 2.7% |
| Median | 1.9% | 2.5% |
| Interquartile 25% (IQ1) | 1.3% | 2.0% |
| Interquartile 75% (IQ3) | 2.4% | 3.5% |
| Interquartile Range (IQR) | 1.1% | 1.5% |
| Standard Deviation (Sample) | 0.92% | 1.3% |
| Standard Deviation (Population) | 0.91% | 1.3% |
Similar Demographics by Single Father Households
Demographics Similar to Cambodians by Single Father Households
In terms of single father households, the demographic groups most similar to Cambodians are Bulgarian (2.0%, a difference of 0.020%), Israeli (2.0%, a difference of 0.030%), Chinese (2.0%, a difference of 0.070%), Immigrants from Japan (2.0%, a difference of 0.11%), and Turkish (2.0%, a difference of 0.28%).
| Demographics | Rating | Rank | Single Father Households |
| Immigrants | Croatia | 100.0 /100 | #23 | Exceptional 2.0% |
| Immigrants | Russia | 100.0 /100 | #24 | Exceptional 2.0% |
| Eastern Europeans | 100.0 /100 | #25 | Exceptional 2.0% |
| Assyrians/Chaldeans/Syriacs | 100.0 /100 | #26 | Exceptional 2.0% |
| Immigrants | South Central Asia | 100.0 /100 | #27 | Exceptional 2.0% |
| Immigrants | Japan | 100.0 /100 | #28 | Exceptional 2.0% |
| Bulgarians | 100.0 /100 | #29 | Exceptional 2.0% |
| Cambodians | 100.0 /100 | #30 | Exceptional 2.0% |
| Israelis | 100.0 /100 | #31 | Exceptional 2.0% |
| Chinese | 100.0 /100 | #32 | Exceptional 2.0% |
| Turks | 100.0 /100 | #33 | Exceptional 2.0% |
| Immigrants | Australia | 100.0 /100 | #34 | Exceptional 2.0% |
| Albanians | 100.0 /100 | #35 | Exceptional 2.0% |
| Immigrants | Belgium | 100.0 /100 | #36 | Exceptional 2.0% |
| Immigrants | St. Vincent and the Grenadines | 100.0 /100 | #37 | Exceptional 2.0% |
Demographics Similar to Immigrants from Portugal by Single Father Households
In terms of single father households, the demographic groups most similar to Immigrants from Portugal are Nicaraguan (2.6%, a difference of 0.010%), Dutch West Indian (2.6%, a difference of 0.060%), Samoan (2.6%, a difference of 0.55%), Cherokee (2.6%, a difference of 0.59%), and Shoshone (2.6%, a difference of 0.64%).
| Demographics | Rating | Rank | Single Father Households |
| Iroquois | 0.2 /100 | #273 | Tragic 2.6% |
| Puerto Ricans | 0.2 /100 | #274 | Tragic 2.6% |
| Immigrants | Dominican Republic | 0.2 /100 | #275 | Tragic 2.6% |
| Immigrants | Haiti | 0.1 /100 | #276 | Tragic 2.6% |
| Shoshone | 0.1 /100 | #277 | Tragic 2.6% |
| Cherokee | 0.1 /100 | #278 | Tragic 2.6% |
| Samoans | 0.1 /100 | #279 | Tragic 2.6% |
| Immigrants | Portugal | 0.1 /100 | #280 | Tragic 2.6% |
| Nicaraguans | 0.1 /100 | #281 | Tragic 2.6% |
| Dutch West Indians | 0.1 /100 | #282 | Tragic 2.6% |
| Immigrants | Nicaragua | 0.1 /100 | #283 | Tragic 2.7% |
| Hawaiians | 0.1 /100 | #284 | Tragic 2.7% |
| Ottawa | 0.1 /100 | #285 | Tragic 2.7% |
| Immigrants | Cuba | 0.1 /100 | #286 | Tragic 2.7% |
| Central American Indians | 0.0 /100 | #287 | Tragic 2.7% |