Tongan vs Immigrants from Portugal Median Male Earnings
COMPARE
Tongan
Immigrants from Portugal
Median Male Earnings
Median Male Earnings Comparison
Tongans
Immigrants from Portugal
$53,218
MEDIAN MALE EARNINGS
22.3/ 100
METRIC RATING
199th/ 347
METRIC RANK
$55,182
MEDIAN MALE EARNINGS
66.3/ 100
METRIC RATING
165th/ 347
METRIC RANK
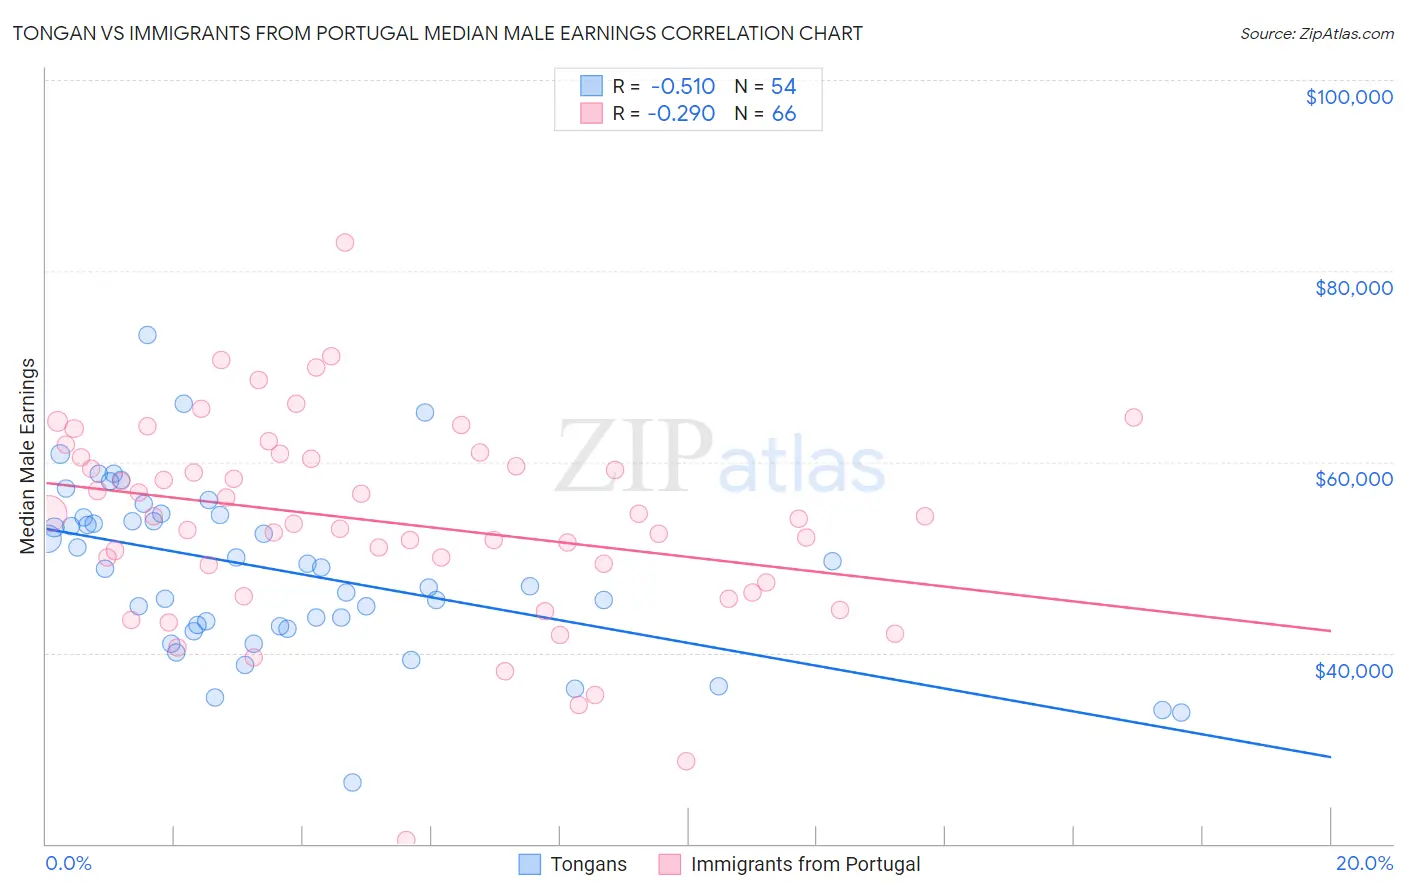
Tongan vs Immigrants from Portugal Median Male Earnings Correlation Chart
The statistical analysis conducted on geographies consisting of 102,813,527 people shows a substantial negative correlation between the proportion of Tongans and median male earnings in the United States with a correlation coefficient (R) of -0.510 and weighted average of $53,218. Similarly, the statistical analysis conducted on geographies consisting of 174,772,823 people shows a weak negative correlation between the proportion of Immigrants from Portugal and median male earnings in the United States with a correlation coefficient (R) of -0.290 and weighted average of $55,182, a difference of 3.7%.
Median Male Earnings Correlation Summary
| Measurement | Tongan | Immigrants from Portugal |
| Minimum | $26,442 | $20,417 |
| Maximum | $73,315 | $82,976 |
| Range | $46,873 | $62,559 |
| Mean | $48,593 | $53,702 |
| Median | $48,873 | $54,126 |
| Interquartile 25% (IQ1) | $42,778 | $47,334 |
| Interquartile 75% (IQ3) | $54,132 | $60,481 |
| Interquartile Range (IQR) | $11,354 | $13,147 |
| Standard Deviation (Sample) | $8,947 | $10,627 |
| Standard Deviation (Population) | $8,864 | $10,546 |
Similar Demographics by Median Male Earnings
Demographics Similar to Tongans by Median Male Earnings
In terms of median male earnings, the demographic groups most similar to Tongans are Immigrants from Costa Rica ($53,237, a difference of 0.030%), Immigrants from Kenya ($53,427, a difference of 0.39%), Immigrants from Africa ($53,457, a difference of 0.45%), Immigrants from the Azores ($53,503, a difference of 0.53%), and Immigrants from Thailand ($52,908, a difference of 0.59%).
| Demographics | Rating | Rank | Median Male Earnings |
| Scotch-Irish | 30.6 /100 | #192 | Fair $53,658 |
| Kenyans | 30.4 /100 | #193 | Fair $53,647 |
| Spanish | 29.0 /100 | #194 | Fair $53,576 |
| Immigrants | Azores | 27.5 /100 | #195 | Fair $53,503 |
| Immigrants | Africa | 26.6 /100 | #196 | Fair $53,457 |
| Immigrants | Kenya | 26.0 /100 | #197 | Fair $53,427 |
| Immigrants | Costa Rica | 22.6 /100 | #198 | Fair $53,237 |
| Tongans | 22.3 /100 | #199 | Fair $53,218 |
| Immigrants | Thailand | 17.5 /100 | #200 | Poor $52,908 |
| Immigrants | Bosnia and Herzegovina | 16.9 /100 | #201 | Poor $52,869 |
| Immigrants | Uruguay | 16.8 /100 | #202 | Poor $52,860 |
| Panamanians | 16.5 /100 | #203 | Poor $52,835 |
| Ghanaians | 16.1 /100 | #204 | Poor $52,810 |
| Immigrants | Colombia | 15.0 /100 | #205 | Poor $52,725 |
| Immigrants | Iraq | 14.5 /100 | #206 | Poor $52,681 |
Demographics Similar to Immigrants from Portugal by Median Male Earnings
In terms of median male earnings, the demographic groups most similar to Immigrants from Portugal are Immigrants from South Eastern Asia ($55,241, a difference of 0.11%), Ugandan ($55,290, a difference of 0.20%), French ($55,350, a difference of 0.31%), Belgian ($55,361, a difference of 0.32%), and Basque ($55,370, a difference of 0.34%).
| Demographics | Rating | Rank | Median Male Earnings |
| Czechoslovakians | 70.5 /100 | #158 | Good $55,382 |
| Alsatians | 70.5 /100 | #159 | Good $55,380 |
| Basques | 70.3 /100 | #160 | Good $55,370 |
| Belgians | 70.1 /100 | #161 | Good $55,361 |
| French | 69.9 /100 | #162 | Good $55,350 |
| Ugandans | 68.6 /100 | #163 | Good $55,290 |
| Immigrants | South Eastern Asia | 67.6 /100 | #164 | Good $55,241 |
| Immigrants | Portugal | 66.3 /100 | #165 | Good $55,182 |
| Germans | 61.6 /100 | #166 | Good $54,974 |
| Immigrants | Fiji | 61.2 /100 | #167 | Good $54,958 |
| Immigrants | Vietnam | 60.2 /100 | #168 | Good $54,913 |
| French Canadians | 55.6 /100 | #169 | Average $54,722 |
| Finns | 55.6 /100 | #170 | Average $54,721 |
| Immigrants | Peru | 54.9 /100 | #171 | Average $54,695 |
| Welsh | 53.8 /100 | #172 | Average $54,647 |