Bulgarian vs Colombian Wage/Income Gap
COMPARE
Bulgarian
Colombian
Wage/Income Gap
Wage/Income Gap Comparison
Bulgarians
Colombians
27.8%
WAGE/INCOME GAP
0.7/ 100
METRIC RATING
273rd/ 347
METRIC RANK
24.7%
WAGE/INCOME GAP
92.4/ 100
METRIC RATING
133rd/ 347
METRIC RANK
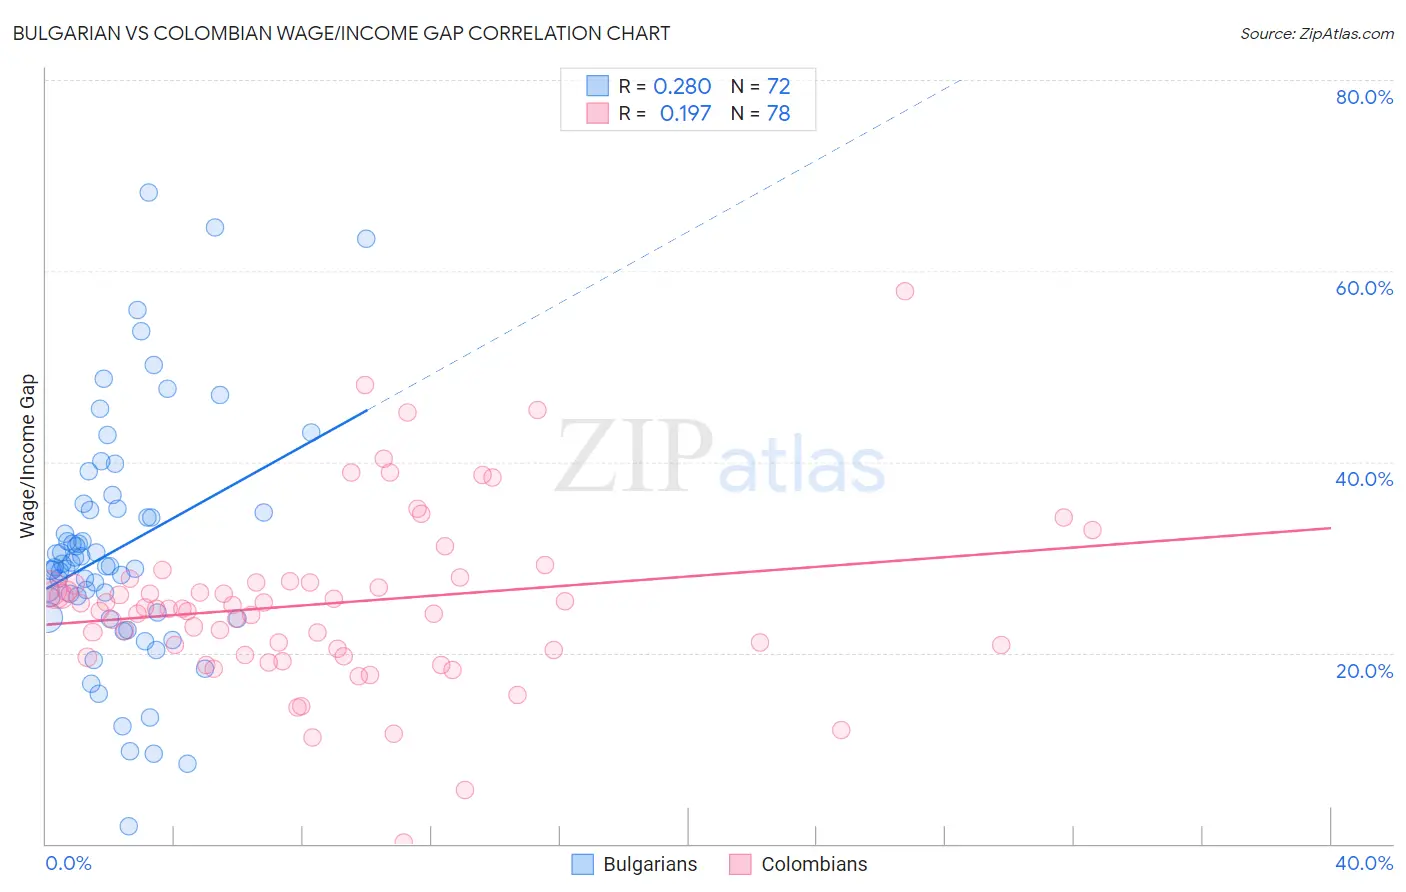
Bulgarian vs Colombian Wage/Income Gap Correlation Chart
The statistical analysis conducted on geographies consisting of 205,588,270 people shows a weak positive correlation between the proportion of Bulgarians and wage/income gap percentage in the United States with a correlation coefficient (R) of 0.280 and weighted average of 27.8%. Similarly, the statistical analysis conducted on geographies consisting of 419,429,082 people shows a poor positive correlation between the proportion of Colombians and wage/income gap percentage in the United States with a correlation coefficient (R) of 0.197 and weighted average of 24.7%, a difference of 12.6%.
Wage/Income Gap Correlation Summary
| Measurement | Bulgarian | Colombian |
| Minimum | 1.9% | 0.074% |
| Maximum | 68.2% | 57.8% |
| Range | 66.3% | 57.8% |
| Mean | 30.9% | 25.2% |
| Median | 29.1% | 24.6% |
| Interquartile 25% (IQ1) | 23.9% | 20.3% |
| Interquartile 75% (IQ3) | 35.1% | 27.4% |
| Interquartile Range (IQR) | 11.1% | 7.1% |
| Standard Deviation (Sample) | 12.6% | 9.1% |
| Standard Deviation (Population) | 12.5% | 9.0% |
Similar Demographics by Wage/Income Gap
Demographics Similar to Bulgarians by Wage/Income Gap
In terms of wage/income gap, the demographic groups most similar to Bulgarians are American (27.8%, a difference of 0.040%), Immigrants from Korea (27.8%, a difference of 0.11%), Immigrants from Japan (27.9%, a difference of 0.12%), Lebanese (27.9%, a difference of 0.15%), and Latvian (27.9%, a difference of 0.15%).
| Demographics | Rating | Rank | Wage/Income Gap |
| Hmong | 1.0 /100 | #266 | Tragic 27.7% |
| Turks | 1.0 /100 | #267 | Tragic 27.7% |
| New Zealanders | 1.0 /100 | #268 | Tragic 27.7% |
| Potawatomi | 0.9 /100 | #269 | Tragic 27.7% |
| Immigrants | Western Europe | 0.9 /100 | #270 | Tragic 27.8% |
| Ute | 0.8 /100 | #271 | Tragic 27.8% |
| Immigrants | Korea | 0.8 /100 | #272 | Tragic 27.8% |
| Bulgarians | 0.7 /100 | #273 | Tragic 27.8% |
| Americans | 0.7 /100 | #274 | Tragic 27.8% |
| Immigrants | Japan | 0.7 /100 | #275 | Tragic 27.9% |
| Lebanese | 0.7 /100 | #276 | Tragic 27.9% |
| Latvians | 0.7 /100 | #277 | Tragic 27.9% |
| Immigrants | England | 0.6 /100 | #278 | Tragic 27.9% |
| Romanians | 0.5 /100 | #279 | Tragic 28.0% |
| Russians | 0.5 /100 | #280 | Tragic 28.0% |
Demographics Similar to Colombians by Wage/Income Gap
In terms of wage/income gap, the demographic groups most similar to Colombians are Immigrants from Costa Rica (24.7%, a difference of 0.0%), Mexican American Indian (24.7%, a difference of 0.030%), South American Indian (24.7%, a difference of 0.090%), Immigrants from Philippines (24.7%, a difference of 0.15%), and Alsatian (24.7%, a difference of 0.22%).
| Demographics | Rating | Rank | Wage/Income Gap |
| Immigrants | Uruguay | 93.8 /100 | #126 | Exceptional 24.6% |
| German Russians | 93.7 /100 | #127 | Exceptional 24.6% |
| Immigrants | Central America | 93.5 /100 | #128 | Exceptional 24.6% |
| Yup'ik | 93.3 /100 | #129 | Exceptional 24.7% |
| Alsatians | 93.2 /100 | #130 | Exceptional 24.7% |
| Immigrants | Philippines | 93.0 /100 | #131 | Exceptional 24.7% |
| Immigrants | Costa Rica | 92.4 /100 | #132 | Exceptional 24.7% |
| Colombians | 92.4 /100 | #133 | Exceptional 24.7% |
| Mexican American Indians | 92.2 /100 | #134 | Exceptional 24.7% |
| South American Indians | 92.0 /100 | #135 | Exceptional 24.7% |
| Armenians | 91.3 /100 | #136 | Exceptional 24.8% |
| Immigrants | South Eastern Asia | 90.9 /100 | #137 | Exceptional 24.8% |
| Immigrants | Bosnia and Herzegovina | 90.1 /100 | #138 | Exceptional 24.8% |
| Hispanics or Latinos | 89.5 /100 | #139 | Excellent 24.9% |
| Immigrants | Nepal | 89.3 /100 | #140 | Excellent 24.9% |