Bulgarian vs Colombian Poverty
COMPARE
Bulgarian
Colombian
Poverty
Poverty Comparison
Bulgarians
Colombians
10.2%
POVERTY
99.9/ 100
METRIC RATING
10th/ 347
METRIC RANK
12.2%
POVERTY
57.8/ 100
METRIC RATING
164th/ 347
METRIC RANK
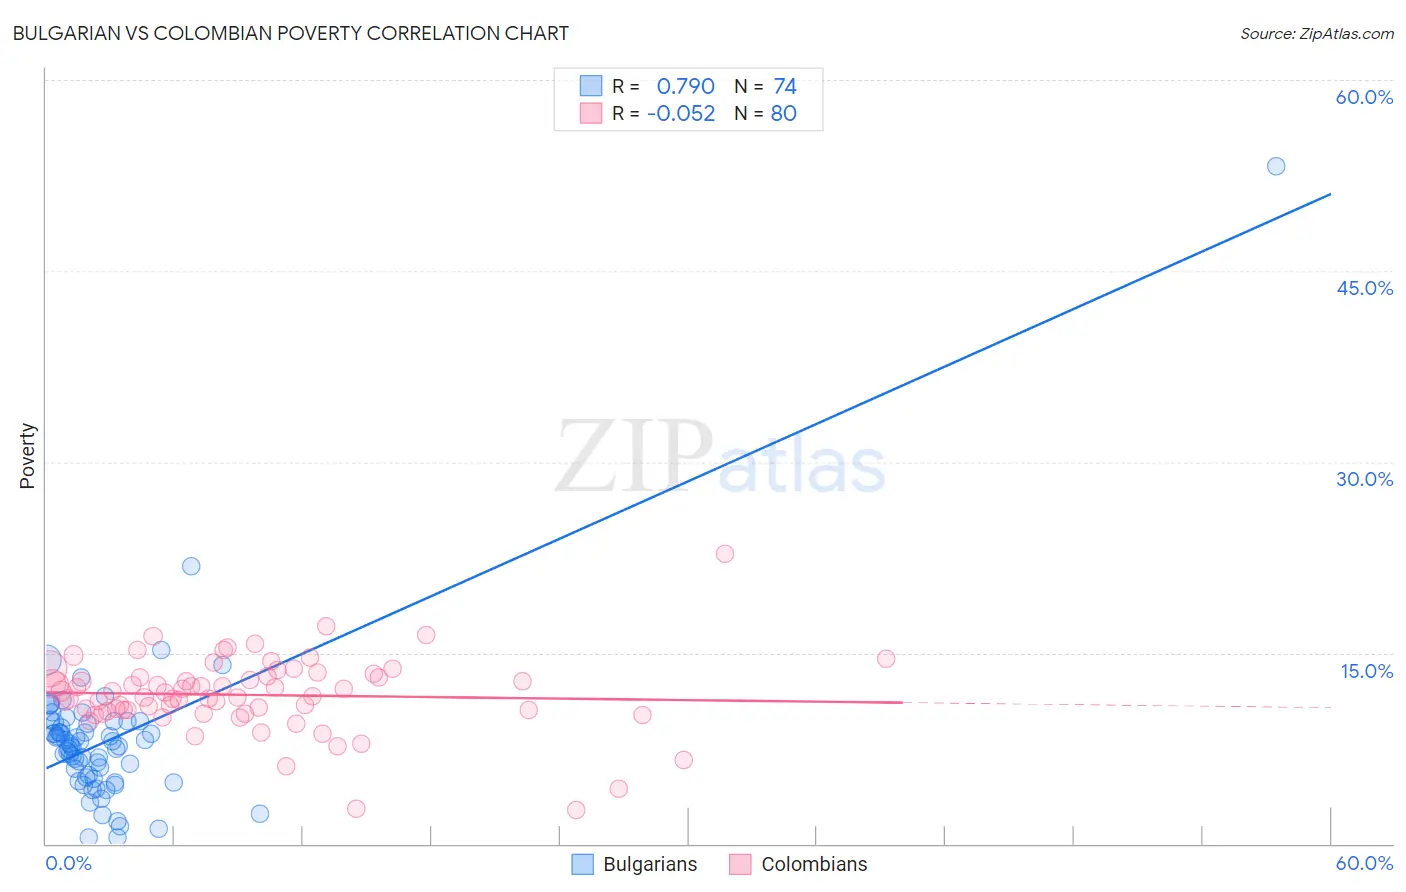
Bulgarian vs Colombian Poverty Correlation Chart
The statistical analysis conducted on geographies consisting of 205,564,290 people shows a strong positive correlation between the proportion of Bulgarians and poverty level in the United States with a correlation coefficient (R) of 0.790 and weighted average of 10.2%. Similarly, the statistical analysis conducted on geographies consisting of 419,330,126 people shows a slight negative correlation between the proportion of Colombians and poverty level in the United States with a correlation coefficient (R) of -0.052 and weighted average of 12.2%, a difference of 19.3%.
Poverty Correlation Summary
| Measurement | Bulgarian | Colombian |
| Minimum | 0.47% | 2.6% |
| Maximum | 53.2% | 22.8% |
| Range | 52.7% | 20.2% |
| Mean | 8.2% | 11.7% |
| Median | 7.8% | 11.7% |
| Interquartile 25% (IQ1) | 5.2% | 10.5% |
| Interquartile 75% (IQ3) | 9.5% | 13.1% |
| Interquartile Range (IQR) | 4.3% | 2.7% |
| Standard Deviation (Sample) | 6.4% | 3.0% |
| Standard Deviation (Population) | 6.3% | 3.0% |
Similar Demographics by Poverty
Demographics Similar to Bulgarians by Poverty
In terms of poverty, the demographic groups most similar to Bulgarians are Immigrants from South Central Asia (10.2%, a difference of 0.41%), Maltese (10.2%, a difference of 0.86%), Immigrants from Lithuania (10.3%, a difference of 0.99%), Filipino (10.1%, a difference of 1.3%), and Bhutanese (10.4%, a difference of 1.3%).
| Demographics | Rating | Rank | Poverty |
| Thais | 100.0 /100 | #3 | Exceptional 9.6% |
| Immigrants | Taiwan | 100.0 /100 | #4 | Exceptional 9.7% |
| Immigrants | Ireland | 99.9 /100 | #5 | Exceptional 10.1% |
| Assyrians/Chaldeans/Syriacs | 99.9 /100 | #6 | Exceptional 10.1% |
| Filipinos | 99.9 /100 | #7 | Exceptional 10.1% |
| Maltese | 99.9 /100 | #8 | Exceptional 10.2% |
| Immigrants | South Central Asia | 99.9 /100 | #9 | Exceptional 10.2% |
| Bulgarians | 99.9 /100 | #10 | Exceptional 10.2% |
| Immigrants | Lithuania | 99.9 /100 | #11 | Exceptional 10.3% |
| Bhutanese | 99.8 /100 | #12 | Exceptional 10.4% |
| Immigrants | Hong Kong | 99.8 /100 | #13 | Exceptional 10.4% |
| Immigrants | Bolivia | 99.8 /100 | #14 | Exceptional 10.4% |
| Bolivians | 99.8 /100 | #15 | Exceptional 10.4% |
| Lithuanians | 99.8 /100 | #16 | Exceptional 10.5% |
| Norwegians | 99.8 /100 | #17 | Exceptional 10.5% |
Demographics Similar to Colombians by Poverty
In terms of poverty, the demographic groups most similar to Colombians are Immigrants from Albania (12.2%, a difference of 0.010%), Immigrants from Ethiopia (12.2%, a difference of 0.070%), Venezuelan (12.2%, a difference of 0.10%), Immigrants from Chile (12.2%, a difference of 0.11%), and Ethiopian (12.2%, a difference of 0.12%).
| Demographics | Rating | Rank | Poverty |
| Costa Ricans | 62.2 /100 | #157 | Good 12.2% |
| Taiwanese | 61.8 /100 | #158 | Good 12.2% |
| Pennsylvania Germans | 60.8 /100 | #159 | Good 12.2% |
| Immigrants | Nepal | 60.4 /100 | #160 | Good 12.2% |
| Immigrants | Fiji | 59.1 /100 | #161 | Average 12.2% |
| Ethiopians | 59.1 /100 | #162 | Average 12.2% |
| Immigrants | Ethiopia | 58.6 /100 | #163 | Average 12.2% |
| Colombians | 57.8 /100 | #164 | Average 12.2% |
| Immigrants | Albania | 57.7 /100 | #165 | Average 12.2% |
| Venezuelans | 56.9 /100 | #166 | Average 12.2% |
| Immigrants | Chile | 56.7 /100 | #167 | Average 12.2% |
| Immigrants | Venezuela | 56.5 /100 | #168 | Average 12.2% |
| Whites/Caucasians | 55.4 /100 | #169 | Average 12.3% |
| Immigrants | Oceania | 54.6 /100 | #170 | Average 12.3% |
| Immigrants | Spain | 51.3 /100 | #171 | Average 12.3% |