Bulgarian vs Colombian 6th Grade
COMPARE
Bulgarian
Colombian
6th Grade
6th Grade Comparison
Bulgarians
Colombians
97.8%
6TH GRADE
99.9/ 100
METRIC RATING
45th/ 347
METRIC RANK
96.5%
6TH GRADE
0.9/ 100
METRIC RATING
249th/ 347
METRIC RANK
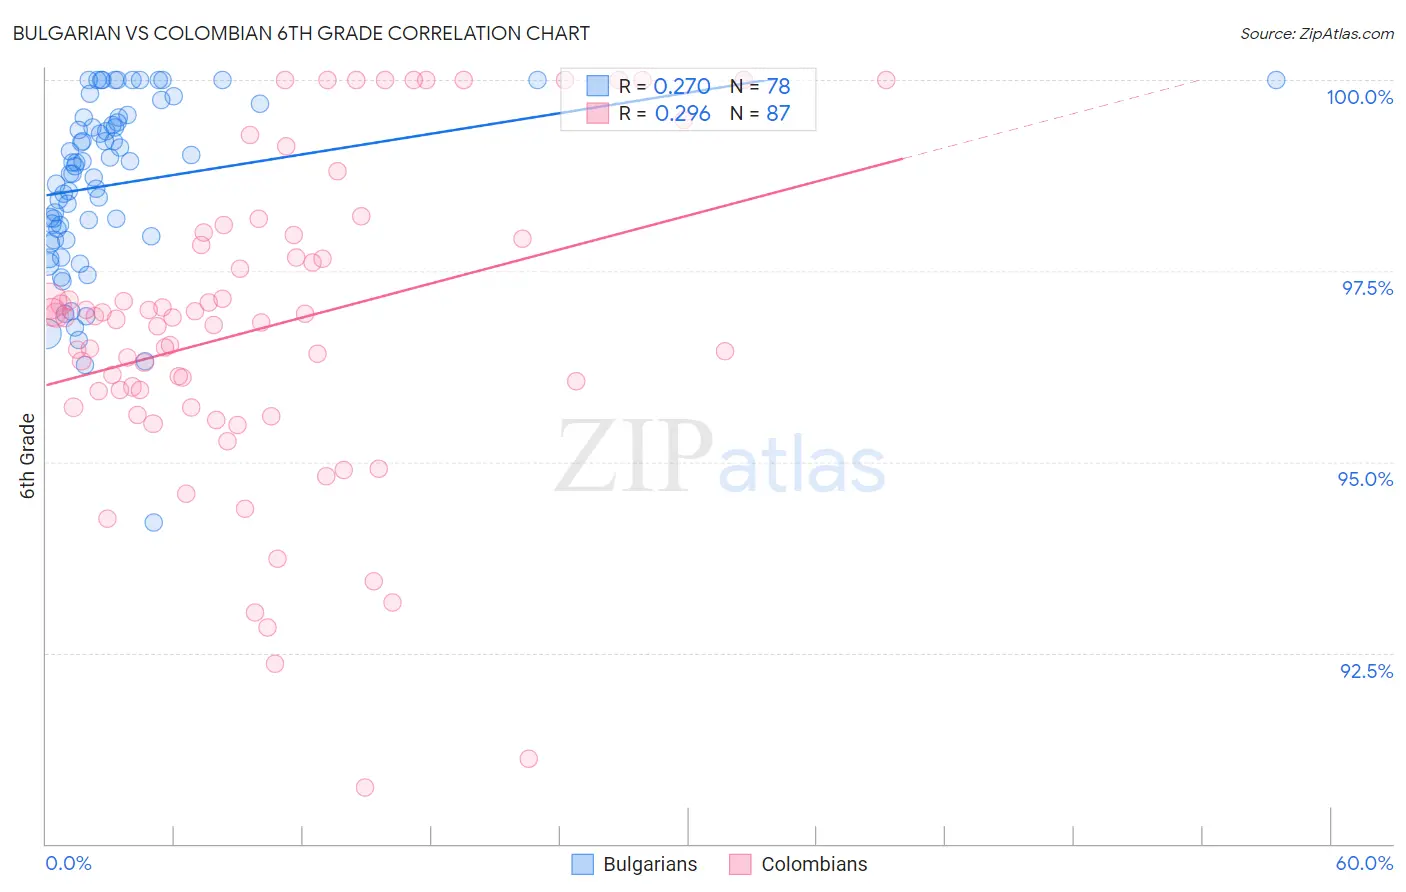
Bulgarian vs Colombian 6th Grade Correlation Chart
The statistical analysis conducted on geographies consisting of 205,633,223 people shows a weak positive correlation between the proportion of Bulgarians and percentage of population with at least 6th grade education in the United States with a correlation coefficient (R) of 0.270 and weighted average of 97.8%. Similarly, the statistical analysis conducted on geographies consisting of 419,655,116 people shows a weak positive correlation between the proportion of Colombians and percentage of population with at least 6th grade education in the United States with a correlation coefficient (R) of 0.296 and weighted average of 96.5%, a difference of 1.3%.
6th Grade Correlation Summary
| Measurement | Bulgarian | Colombian |
| Minimum | 94.2% | 90.7% |
| Maximum | 100.0% | 100.0% |
| Range | 5.8% | 9.3% |
| Mean | 98.6% | 96.8% |
| Median | 98.9% | 96.9% |
| Interquartile 25% (IQ1) | 98.0% | 95.7% |
| Interquartile 75% (IQ3) | 99.5% | 97.9% |
| Interquartile Range (IQR) | 1.6% | 2.2% |
| Standard Deviation (Sample) | 1.1% | 2.0% |
| Standard Deviation (Population) | 1.1% | 2.0% |
Similar Demographics by 6th Grade
Demographics Similar to Bulgarians by 6th Grade
In terms of 6th grade, the demographic groups most similar to Bulgarians are Arapaho (97.8%, a difference of 0.010%), Czechoslovakian (97.8%, a difference of 0.020%), Native Hawaiian (97.8%, a difference of 0.020%), Celtic (97.8%, a difference of 0.020%), and Estonian (97.8%, a difference of 0.020%).
| Demographics | Rating | Rank | 6th Grade |
| Belgians | 100.0 /100 | #38 | Exceptional 97.9% |
| Luxembourgers | 99.9 /100 | #39 | Exceptional 97.9% |
| Latvians | 99.9 /100 | #40 | Exceptional 97.9% |
| Eastern Europeans | 99.9 /100 | #41 | Exceptional 97.9% |
| Hungarians | 99.9 /100 | #42 | Exceptional 97.8% |
| Northern Europeans | 99.9 /100 | #43 | Exceptional 97.8% |
| Czechoslovakians | 99.9 /100 | #44 | Exceptional 97.8% |
| Bulgarians | 99.9 /100 | #45 | Exceptional 97.8% |
| Arapaho | 99.9 /100 | #46 | Exceptional 97.8% |
| Native Hawaiians | 99.9 /100 | #47 | Exceptional 97.8% |
| Celtics | 99.9 /100 | #48 | Exceptional 97.8% |
| Estonians | 99.8 /100 | #49 | Exceptional 97.8% |
| Immigrants | Scotland | 99.8 /100 | #50 | Exceptional 97.8% |
| Maltese | 99.8 /100 | #51 | Exceptional 97.8% |
| Australians | 99.8 /100 | #52 | Exceptional 97.8% |
Demographics Similar to Colombians by 6th Grade
In terms of 6th grade, the demographic groups most similar to Colombians are Tohono O'odham (96.5%, a difference of 0.0%), Bolivian (96.5%, a difference of 0.010%), Immigrants from Middle Africa (96.5%, a difference of 0.020%), Immigrants from Costa Rica (96.6%, a difference of 0.040%), and Immigrants from Africa (96.6%, a difference of 0.040%).
| Demographics | Rating | Rank | 6th Grade |
| Immigrants | Asia | 1.8 /100 | #242 | Tragic 96.6% |
| Immigrants | Liberia | 1.6 /100 | #243 | Tragic 96.6% |
| Ethiopians | 1.5 /100 | #244 | Tragic 96.6% |
| Immigrants | Costa Rica | 1.3 /100 | #245 | Tragic 96.6% |
| Immigrants | Africa | 1.3 /100 | #246 | Tragic 96.6% |
| Bolivians | 1.0 /100 | #247 | Tragic 96.5% |
| Tohono O'odham | 1.0 /100 | #248 | Tragic 96.5% |
| Colombians | 0.9 /100 | #249 | Tragic 96.5% |
| Immigrants | Middle Africa | 0.8 /100 | #250 | Tragic 96.5% |
| Immigrants | Senegal | 0.7 /100 | #251 | Tragic 96.5% |
| Immigrants | Uruguay | 0.6 /100 | #252 | Tragic 96.5% |
| Jamaicans | 0.6 /100 | #253 | Tragic 96.5% |
| Immigrants | Ethiopia | 0.6 /100 | #254 | Tragic 96.5% |
| Immigrants | Congo | 0.6 /100 | #255 | Tragic 96.5% |
| U.S. Virgin Islanders | 0.5 /100 | #256 | Tragic 96.5% |