Bulgarian vs Colombian In Labor Force | Age 30-34
COMPARE
Bulgarian
Colombian
In Labor Force | Age 30-34
In Labor Force | Age 30-34 Comparison
Bulgarians
Colombians
86.0%
IN LABOR FORCE | AGE 30-34
100.0/ 100
METRIC RATING
20th/ 347
METRIC RANK
84.9%
IN LABOR FORCE | AGE 30-34
82.2/ 100
METRIC RATING
143rd/ 347
METRIC RANK
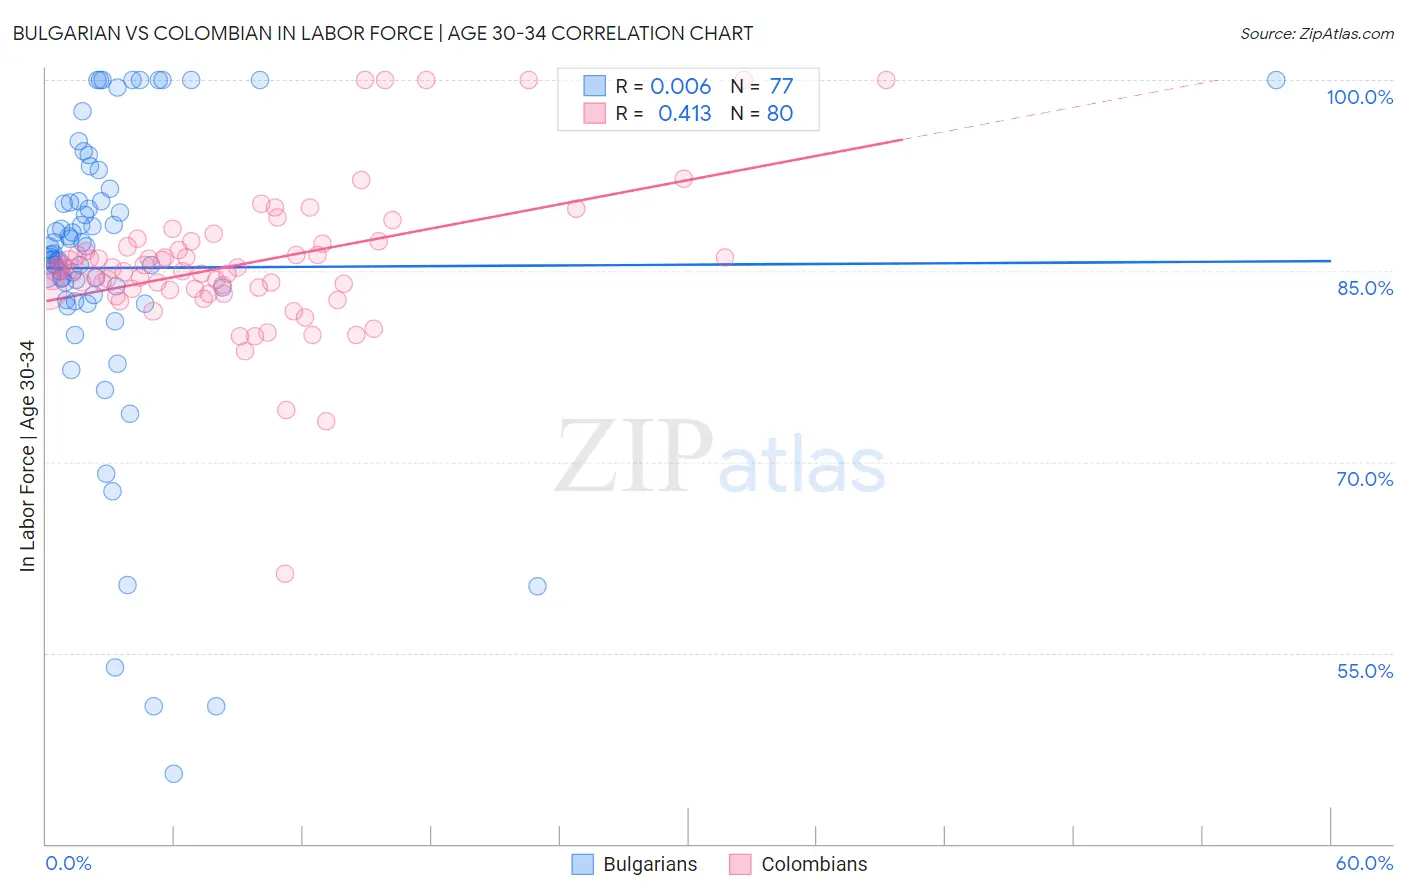
Bulgarian vs Colombian In Labor Force | Age 30-34 Correlation Chart
The statistical analysis conducted on geographies consisting of 205,551,369 people shows no correlation between the proportion of Bulgarians and labor force participation rate among population between the ages 30 and 34 in the United States with a correlation coefficient (R) of 0.006 and weighted average of 86.0%. Similarly, the statistical analysis conducted on geographies consisting of 419,380,718 people shows a moderate positive correlation between the proportion of Colombians and labor force participation rate among population between the ages 30 and 34 in the United States with a correlation coefficient (R) of 0.413 and weighted average of 84.9%, a difference of 1.2%.
In Labor Force | Age 30-34 Correlation Summary
| Measurement | Bulgarian | Colombian |
| Minimum | 45.5% | 61.2% |
| Maximum | 100.0% | 100.0% |
| Range | 54.5% | 38.8% |
| Mean | 85.2% | 85.6% |
| Median | 86.3% | 85.1% |
| Interquartile 25% (IQ1) | 82.9% | 83.5% |
| Interquartile 75% (IQ3) | 90.5% | 87.0% |
| Interquartile Range (IQR) | 7.6% | 3.6% |
| Standard Deviation (Sample) | 11.7% | 5.9% |
| Standard Deviation (Population) | 11.6% | 5.8% |
Similar Demographics by In Labor Force | Age 30-34
Demographics Similar to Bulgarians by In Labor Force | Age 30-34
In terms of in labor force | age 30-34, the demographic groups most similar to Bulgarians are Immigrants from Bulgaria (86.0%, a difference of 0.0%), Sierra Leonean (86.0%, a difference of 0.010%), Bermudan (85.9%, a difference of 0.020%), Estonian (85.9%, a difference of 0.030%), and Immigrants from Eritrea (85.9%, a difference of 0.040%).
| Demographics | Rating | Rank | In Labor Force | Age 30-34 |
| Immigrants | Croatia | 100.0 /100 | #13 | Exceptional 86.1% |
| Immigrants | Cabo Verde | 100.0 /100 | #14 | Exceptional 86.1% |
| Immigrants | Albania | 100.0 /100 | #15 | Exceptional 86.1% |
| Latvians | 100.0 /100 | #16 | Exceptional 86.0% |
| Immigrants | Cameroon | 100.0 /100 | #17 | Exceptional 86.0% |
| Immigrants | Sierra Leone | 100.0 /100 | #18 | Exceptional 86.0% |
| Sierra Leoneans | 100.0 /100 | #19 | Exceptional 86.0% |
| Bulgarians | 100.0 /100 | #20 | Exceptional 86.0% |
| Immigrants | Bulgaria | 100.0 /100 | #21 | Exceptional 86.0% |
| Bermudans | 100.0 /100 | #22 | Exceptional 85.9% |
| Estonians | 100.0 /100 | #23 | Exceptional 85.9% |
| Immigrants | Eritrea | 100.0 /100 | #24 | Exceptional 85.9% |
| Immigrants | North Macedonia | 100.0 /100 | #25 | Exceptional 85.9% |
| Immigrants | Eastern Africa | 100.0 /100 | #26 | Exceptional 85.9% |
| Immigrants | Liberia | 100.0 /100 | #27 | Exceptional 85.9% |
Demographics Similar to Colombians by In Labor Force | Age 30-34
In terms of in labor force | age 30-34, the demographic groups most similar to Colombians are Immigrants from Indonesia (84.9%, a difference of 0.030%), Chilean (84.9%, a difference of 0.040%), Uruguayan (84.9%, a difference of 0.040%), Palestinian (84.9%, a difference of 0.050%), and Immigrants from Vietnam (85.0%, a difference of 0.060%).
| Demographics | Rating | Rank | In Labor Force | Age 30-34 |
| Jordanians | 88.6 /100 | #136 | Excellent 85.0% |
| South Africans | 88.0 /100 | #137 | Excellent 85.0% |
| Sri Lankans | 87.8 /100 | #138 | Excellent 85.0% |
| Bhutanese | 87.5 /100 | #139 | Excellent 85.0% |
| Immigrants | Vietnam | 86.5 /100 | #140 | Excellent 85.0% |
| Chileans | 85.3 /100 | #141 | Excellent 84.9% |
| Immigrants | Indonesia | 84.3 /100 | #142 | Excellent 84.9% |
| Colombians | 82.2 /100 | #143 | Excellent 84.9% |
| Uruguayans | 78.5 /100 | #144 | Good 84.9% |
| Palestinians | 77.7 /100 | #145 | Good 84.9% |
| Immigrants | Saudi Arabia | 76.6 /100 | #146 | Good 84.9% |
| Immigrants | Colombia | 76.3 /100 | #147 | Good 84.9% |
| Immigrants | Pakistan | 76.2 /100 | #148 | Good 84.9% |
| Immigrants | Ukraine | 75.1 /100 | #149 | Good 84.8% |
| Germans | 75.1 /100 | #150 | Good 84.8% |