Ottawa vs Yup'ik Householder Income Under 25 years
COMPARE
Ottawa
Yup'ik
Householder Income Under 25 years
Householder Income Under 25 years Comparison
Ottawa
Yup'ik
$47,366
HOUSEHOLDER INCOME UNDER 25 YEARS
0.0/ 100
METRIC RATING
311th/ 347
METRIC RANK
$54,732
HOUSEHOLDER INCOME UNDER 25 YEARS
99.8/ 100
METRIC RATING
65th/ 347
METRIC RANK
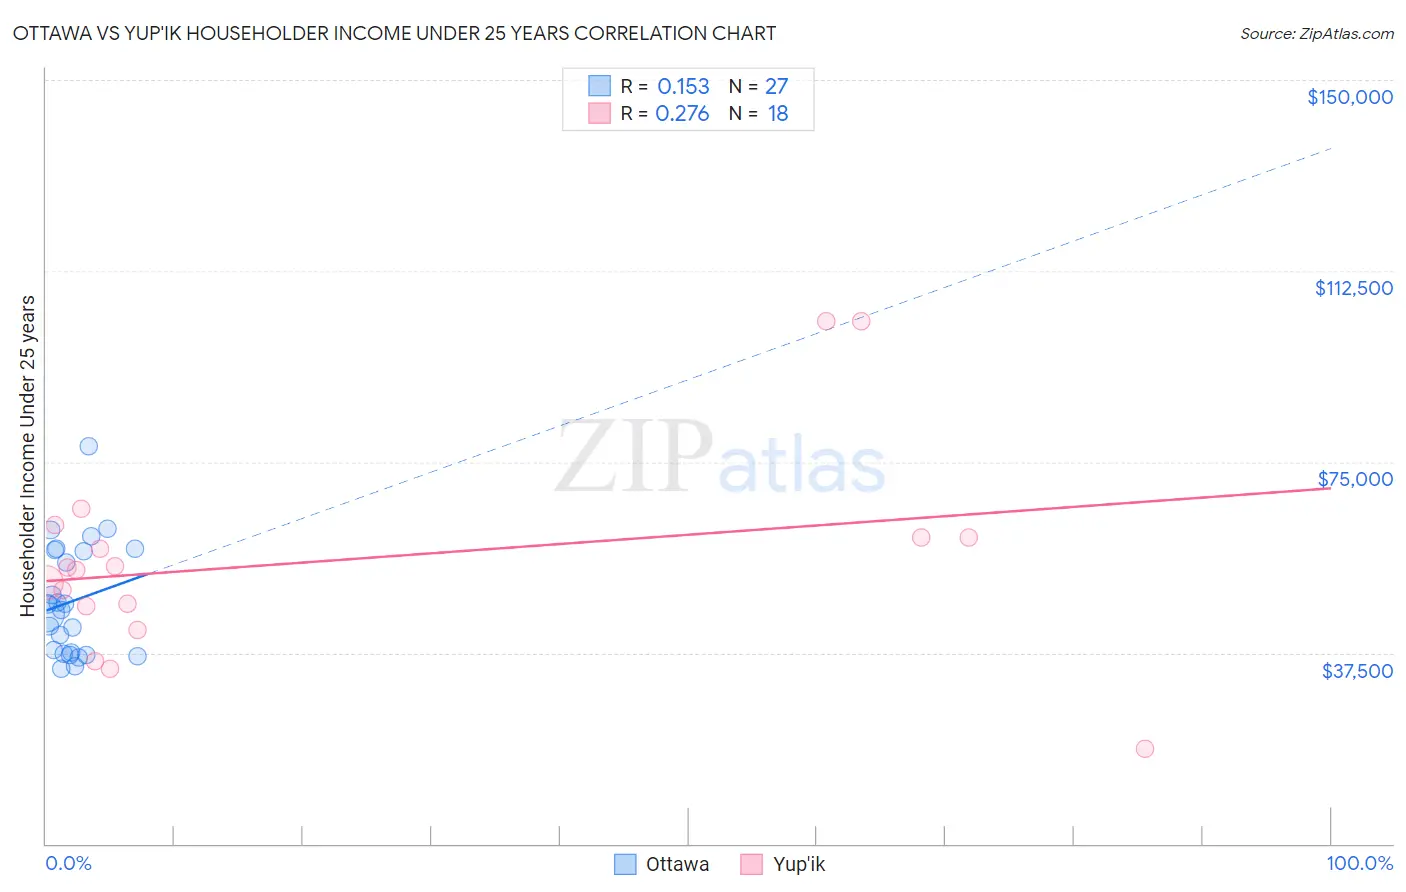
Ottawa vs Yup'ik Householder Income Under 25 years Correlation Chart
The statistical analysis conducted on geographies consisting of 47,461,355 people shows a poor positive correlation between the proportion of Ottawa and household income with householder under the age of 25 in the United States with a correlation coefficient (R) of 0.153 and weighted average of $47,366. Similarly, the statistical analysis conducted on geographies consisting of 38,257,105 people shows a weak positive correlation between the proportion of Yup'ik and household income with householder under the age of 25 in the United States with a correlation coefficient (R) of 0.276 and weighted average of $54,732, a difference of 15.5%.
Householder Income Under 25 years Correlation Summary
| Measurement | Ottawa | Yup'ik |
| Minimum | $34,394 | $18,750 |
| Maximum | $78,125 | $102,500 |
| Range | $43,731 | $83,750 |
| Mean | $47,623 | $55,559 |
| Median | $46,012 | $54,036 |
| Interquartile 25% (IQ1) | $37,201 | $46,548 |
| Interquartile 75% (IQ3) | $57,615 | $60,268 |
| Interquartile Range (IQR) | $20,414 | $13,720 |
| Standard Deviation (Sample) | $11,046 | $20,577 |
| Standard Deviation (Population) | $10,839 | $19,998 |
Similar Demographics by Householder Income Under 25 years
Demographics Similar to Ottawa by Householder Income Under 25 years
In terms of householder income under 25 years, the demographic groups most similar to Ottawa are Bermudan ($47,359, a difference of 0.010%), Iroquois ($47,380, a difference of 0.030%), U.S. Virgin Islander ($47,448, a difference of 0.17%), Comanche ($47,518, a difference of 0.32%), and Delaware ($47,159, a difference of 0.44%).
| Demographics | Rating | Rank | Householder Income Under 25 years |
| Menominee | 0.0 /100 | #304 | Tragic $47,907 |
| Cherokee | 0.0 /100 | #305 | Tragic $47,848 |
| Natives/Alaskans | 0.0 /100 | #306 | Tragic $47,704 |
| Bangladeshis | 0.0 /100 | #307 | Tragic $47,589 |
| Comanche | 0.0 /100 | #308 | Tragic $47,518 |
| U.S. Virgin Islanders | 0.0 /100 | #309 | Tragic $47,448 |
| Iroquois | 0.0 /100 | #310 | Tragic $47,380 |
| Ottawa | 0.0 /100 | #311 | Tragic $47,366 |
| Bermudans | 0.0 /100 | #312 | Tragic $47,359 |
| Delaware | 0.0 /100 | #313 | Tragic $47,159 |
| Chippewa | 0.0 /100 | #314 | Tragic $47,015 |
| Crow | 0.0 /100 | #315 | Tragic $47,012 |
| Sudanese | 0.0 /100 | #316 | Tragic $46,982 |
| Hopi | 0.0 /100 | #317 | Tragic $46,978 |
| Spanish Americans | 0.0 /100 | #318 | Tragic $46,913 |
Demographics Similar to Yup'ik by Householder Income Under 25 years
In terms of householder income under 25 years, the demographic groups most similar to Yup'ik are Immigrants from Bangladesh ($54,714, a difference of 0.030%), Okinawan ($54,701, a difference of 0.060%), Burmese ($54,800, a difference of 0.12%), Tsimshian ($54,649, a difference of 0.15%), and Immigrants from Belgium ($54,830, a difference of 0.18%).
| Demographics | Rating | Rank | Householder Income Under 25 years |
| Guyanese | 99.9 /100 | #58 | Exceptional $55,210 |
| Native Hawaiians | 99.9 /100 | #59 | Exceptional $55,158 |
| Immigrants | Lithuania | 99.9 /100 | #60 | Exceptional $55,028 |
| Immigrants | Europe | 99.9 /100 | #61 | Exceptional $55,022 |
| Immigrants | Uzbekistan | 99.8 /100 | #62 | Exceptional $54,846 |
| Immigrants | Belgium | 99.8 /100 | #63 | Exceptional $54,830 |
| Burmese | 99.8 /100 | #64 | Exceptional $54,800 |
| Yup'ik | 99.8 /100 | #65 | Exceptional $54,732 |
| Immigrants | Bangladesh | 99.8 /100 | #66 | Exceptional $54,714 |
| Okinawans | 99.8 /100 | #67 | Exceptional $54,701 |
| Tsimshian | 99.8 /100 | #68 | Exceptional $54,649 |
| Samoans | 99.7 /100 | #69 | Exceptional $54,610 |
| Immigrants | El Salvador | 99.7 /100 | #70 | Exceptional $54,599 |
| Immigrants | Morocco | 99.7 /100 | #71 | Exceptional $54,593 |
| Immigrants | Northern Europe | 99.7 /100 | #72 | Exceptional $54,571 |