Black/African American vs Yup'ik 2 or more Vehicles in Household
COMPARE
Black/African American
Yup'ik
2 or more Vehicles in Household
2 or more Vehicles in Household Comparison
Blacks/African Americans
Yup'ik
50.9%
2 OR MORE VEHICLES IN HOUSEHOLD
0.0/ 100
METRIC RATING
293rd/ 347
METRIC RANK
34.9%
2 OR MORE VEHICLES IN HOUSEHOLD
0.0/ 100
METRIC RATING
344th/ 347
METRIC RANK
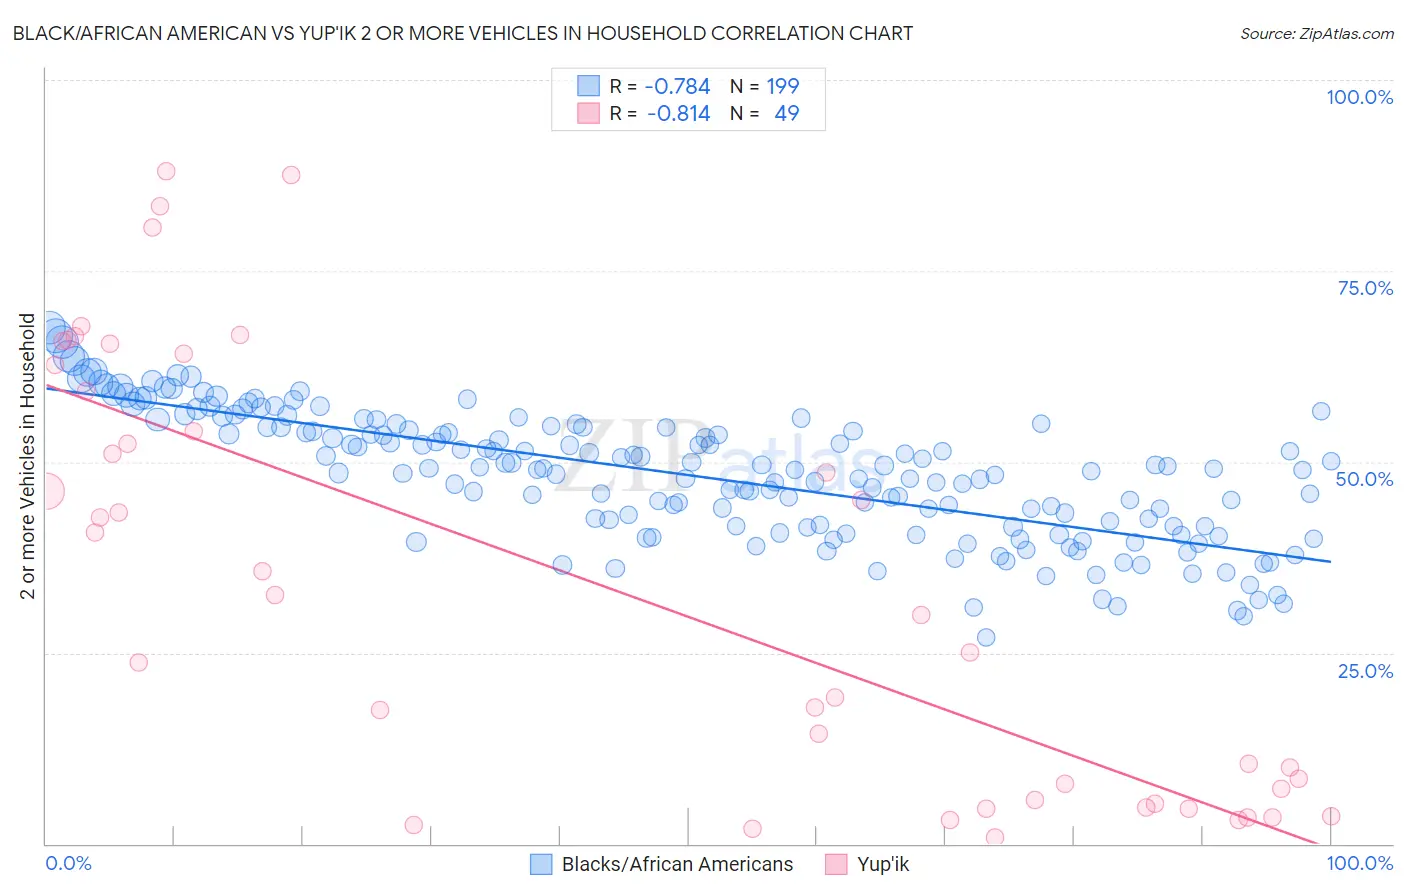
Black/African American vs Yup'ik 2 or more Vehicles in Household Correlation Chart
The statistical analysis conducted on geographies consisting of 553,787,683 people shows a strong negative correlation between the proportion of Blacks/African Americans and percentage of households with 2 or more vehicles available in the United States with a correlation coefficient (R) of -0.784 and weighted average of 50.9%. Similarly, the statistical analysis conducted on geographies consisting of 39,935,819 people shows a very strong negative correlation between the proportion of Yup'ik and percentage of households with 2 or more vehicles available in the United States with a correlation coefficient (R) of -0.814 and weighted average of 34.9%, a difference of 45.6%.
2 or more Vehicles in Household Correlation Summary
| Measurement | Black/African American | Yup'ik |
| Minimum | 26.9% | 0.83% |
| Maximum | 67.6% | 88.1% |
| Range | 40.7% | 87.3% |
| Mean | 48.2% | 33.8% |
| Median | 49.0% | 29.9% |
| Interquartile 25% (IQ1) | 41.5% | 5.5% |
| Interquartile 75% (IQ3) | 54.5% | 61.0% |
| Interquartile Range (IQR) | 13.0% | 55.5% |
| Standard Deviation (Sample) | 8.4% | 27.9% |
| Standard Deviation (Population) | 8.4% | 27.6% |
Similar Demographics by 2 or more Vehicles in Household
Demographics Similar to Blacks/African Americans by 2 or more Vehicles in Household
In terms of 2 or more vehicles in household, the demographic groups most similar to Blacks/African Americans are Immigrants from Ukraine (50.9%, a difference of 0.0%), Belizean (51.0%, a difference of 0.33%), Immigrants from Panama (51.1%, a difference of 0.37%), Somali (51.1%, a difference of 0.43%), and Bermudan (50.6%, a difference of 0.56%).
| Demographics | Rating | Rank | 2 or more Vehicles in Household |
| Immigrants | Liberia | 0.1 /100 | #286 | Tragic 51.3% |
| Immigrants | Serbia | 0.1 /100 | #287 | Tragic 51.3% |
| Okinawans | 0.1 /100 | #288 | Tragic 51.2% |
| Somalis | 0.0 /100 | #289 | Tragic 51.1% |
| Immigrants | Panama | 0.0 /100 | #290 | Tragic 51.1% |
| Belizeans | 0.0 /100 | #291 | Tragic 51.0% |
| Immigrants | Ukraine | 0.0 /100 | #292 | Tragic 50.9% |
| Blacks/African Americans | 0.0 /100 | #293 | Tragic 50.9% |
| Bermudans | 0.0 /100 | #294 | Tragic 50.6% |
| Cypriots | 0.0 /100 | #295 | Tragic 50.6% |
| Immigrants | Somalia | 0.0 /100 | #296 | Tragic 50.5% |
| Immigrants | Spain | 0.0 /100 | #297 | Tragic 50.4% |
| Paraguayans | 0.0 /100 | #298 | Tragic 50.3% |
| Immigrants | Morocco | 0.0 /100 | #299 | Tragic 50.3% |
| Immigrants | Russia | 0.0 /100 | #300 | Tragic 50.3% |
Demographics Similar to Yup'ik by 2 or more Vehicles in Household
In terms of 2 or more vehicles in household, the demographic groups most similar to Yup'ik are Immigrants from Guyana (35.0%, a difference of 0.17%), Dominican (35.3%, a difference of 1.1%), Guyanese (35.4%, a difference of 1.2%), British West Indian (35.4%, a difference of 1.3%), and Immigrants from Barbados (35.8%, a difference of 2.4%).
| Demographics | Rating | Rank | 2 or more Vehicles in Household |
| Immigrants | Ecuador | 0.0 /100 | #333 | Tragic 40.5% |
| Immigrants | Trinidad and Tobago | 0.0 /100 | #334 | Tragic 40.3% |
| Immigrants | Bangladesh | 0.0 /100 | #335 | Tragic 38.8% |
| Vietnamese | 0.0 /100 | #336 | Tragic 38.5% |
| Barbadians | 0.0 /100 | #337 | Tragic 38.3% |
| Immigrants | Uzbekistan | 0.0 /100 | #338 | Tragic 37.9% |
| Immigrants | Barbados | 0.0 /100 | #339 | Tragic 35.8% |
| British West Indians | 0.0 /100 | #340 | Tragic 35.4% |
| Guyanese | 0.0 /100 | #341 | Tragic 35.4% |
| Dominicans | 0.0 /100 | #342 | Tragic 35.3% |
| Immigrants | Guyana | 0.0 /100 | #343 | Tragic 35.0% |
| Yup'ik | 0.0 /100 | #344 | Tragic 34.9% |
| Immigrants | Dominican Republic | 0.0 /100 | #345 | Tragic 33.2% |
| Immigrants | St. Vincent and the Grenadines | 0.0 /100 | #346 | Tragic 31.0% |
| Immigrants | Grenada | 0.0 /100 | #347 | Tragic 28.7% |