Immigrants from Kazakhstan vs Turkish Householder Income Under 25 years
COMPARE
Immigrants from Kazakhstan
Turkish
Householder Income Under 25 years
Householder Income Under 25 years Comparison
Immigrants from Kazakhstan
Turks
$53,990
HOUSEHOLDER INCOME UNDER 25 YEARS
98.8/ 100
METRIC RATING
100th/ 347
METRIC RANK
$54,266
HOUSEHOLDER INCOME UNDER 25 YEARS
99.4/ 100
METRIC RATING
90th/ 347
METRIC RANK
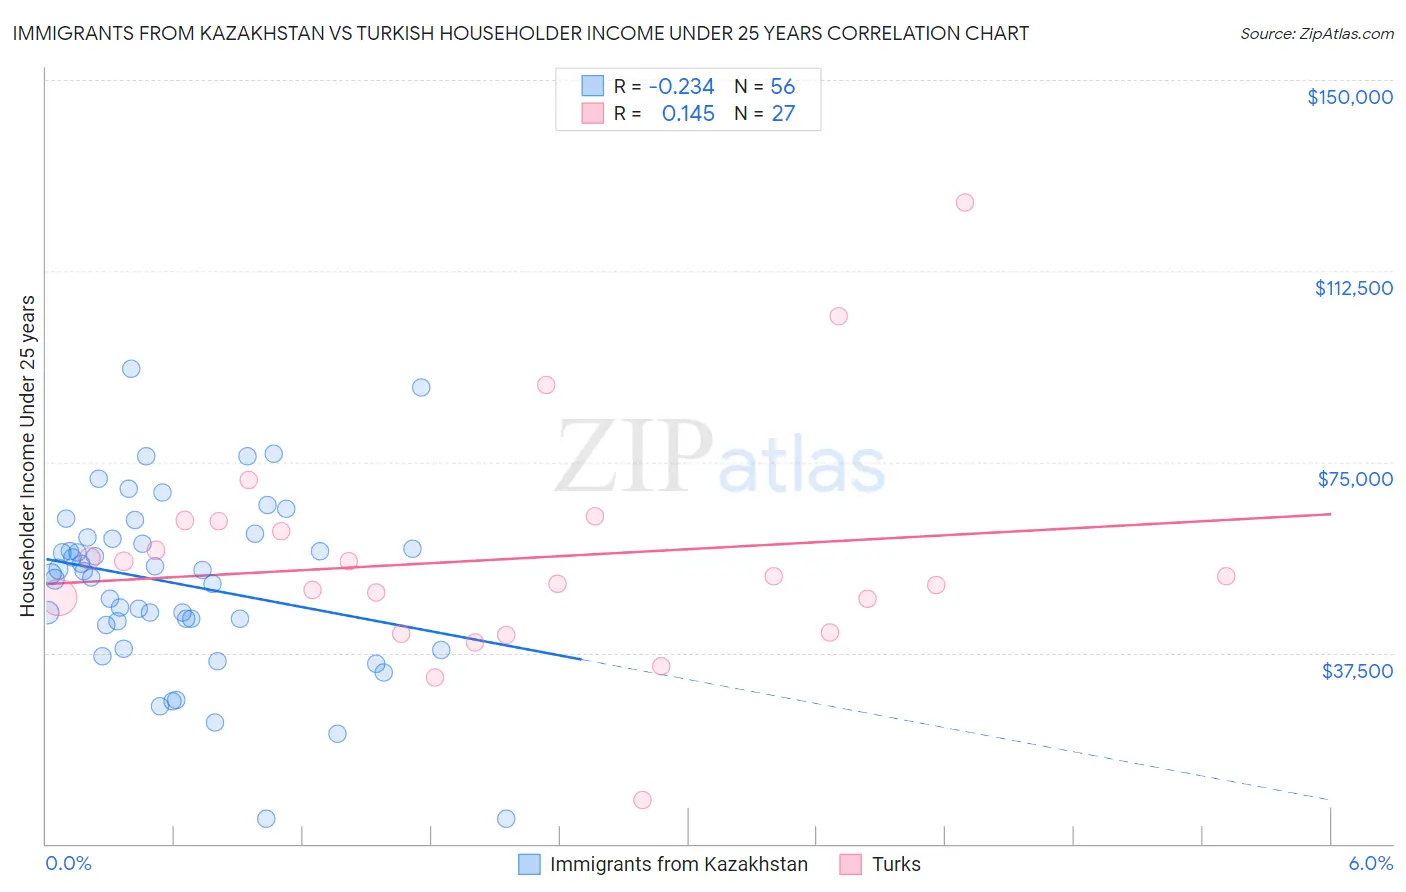
Immigrants from Kazakhstan vs Turkish Householder Income Under 25 years Correlation Chart
The statistical analysis conducted on geographies consisting of 113,998,482 people shows a weak negative correlation between the proportion of Immigrants from Kazakhstan and household income with householder under the age of 25 in the United States with a correlation coefficient (R) of -0.234 and weighted average of $53,990. Similarly, the statistical analysis conducted on geographies consisting of 234,402,010 people shows a poor positive correlation between the proportion of Turks and household income with householder under the age of 25 in the United States with a correlation coefficient (R) of 0.145 and weighted average of $54,266, a difference of 0.51%.
Householder Income Under 25 years Correlation Summary
| Measurement | Immigrants from Kazakhstan | Turkish |
| Minimum | $4,881 | $8,508 |
| Maximum | $93,275 | $125,890 |
| Range | $88,394 | $117,382 |
| Mean | $50,957 | $55,917 |
| Median | $53,277 | $52,500 |
| Interquartile 25% (IQ1) | $43,364 | $41,438 |
| Interquartile 75% (IQ3) | $60,096 | $63,275 |
| Interquartile Range (IQR) | $16,732 | $21,837 |
| Standard Deviation (Sample) | $17,537 | $22,543 |
| Standard Deviation (Population) | $17,380 | $22,121 |
Demographics Similar to Immigrants from Kazakhstan and Turks by Householder Income Under 25 years
In terms of householder income under 25 years, the demographic groups most similar to Immigrants from Kazakhstan are Alaska Native ($54,000, a difference of 0.020%), South American ($53,939, a difference of 0.090%), Eastern European ($54,066, a difference of 0.14%), Ecuadorian ($53,911, a difference of 0.15%), and Immigrants from Portugal ($54,105, a difference of 0.21%). Similarly, the demographic groups most similar to Turks are Immigrants from South America ($54,268, a difference of 0.0%), Immigrants from Egypt ($54,239, a difference of 0.050%), Immigrants from St. Vincent and the Grenadines ($54,230, a difference of 0.070%), Yakama ($54,321, a difference of 0.10%), and Immigrants from Argentina ($54,209, a difference of 0.10%).
| Demographics | Rating | Rank | Householder Income Under 25 years |
| Immigrants | Czechoslovakia | 99.5 /100 | #85 | Exceptional $54,352 |
| Immigrants | Croatia | 99.5 /100 | #86 | Exceptional $54,343 |
| Brazilians | 99.5 /100 | #87 | Exceptional $54,335 |
| Yakama | 99.5 /100 | #88 | Exceptional $54,321 |
| Immigrants | South America | 99.4 /100 | #89 | Exceptional $54,268 |
| Turks | 99.4 /100 | #90 | Exceptional $54,266 |
| Immigrants | Egypt | 99.3 /100 | #91 | Exceptional $54,239 |
| Immigrants | St. Vincent and the Grenadines | 99.3 /100 | #92 | Exceptional $54,230 |
| Immigrants | Argentina | 99.3 /100 | #93 | Exceptional $54,209 |
| Immigrants | Sierra Leone | 99.3 /100 | #94 | Exceptional $54,190 |
| Immigrants | Malaysia | 99.2 /100 | #95 | Exceptional $54,179 |
| Argentineans | 99.2 /100 | #96 | Exceptional $54,154 |
| Immigrants | Portugal | 99.1 /100 | #97 | Exceptional $54,105 |
| Eastern Europeans | 99.0 /100 | #98 | Exceptional $54,066 |
| Alaska Natives | 98.8 /100 | #99 | Exceptional $54,000 |
| Immigrants | Kazakhstan | 98.8 /100 | #100 | Exceptional $53,990 |
| South Americans | 98.6 /100 | #101 | Exceptional $53,939 |
| Ecuadorians | 98.5 /100 | #102 | Exceptional $53,911 |
| Ukrainians | 98.3 /100 | #103 | Exceptional $53,843 |
| Ethiopians | 98.2 /100 | #104 | Exceptional $53,818 |
| Immigrants | France | 98.1 /100 | #105 | Exceptional $53,805 |