Black/African American vs Peruvian Unemployment Among Seniors over 75 years
COMPARE
Black/African American
Peruvian
Unemployment Among Seniors over 75 years
Unemployment Among Seniors over 75 years Comparison
Blacks/African Americans
Peruvians
9.4%
UNEMPLOYMENT AMONG SENIORS OVER 75 YEARS
0.5/ 100
METRIC RATING
266th/ 347
METRIC RANK
9.0%
UNEMPLOYMENT AMONG SENIORS OVER 75 YEARS
7.3/ 100
METRIC RATING
222nd/ 347
METRIC RANK
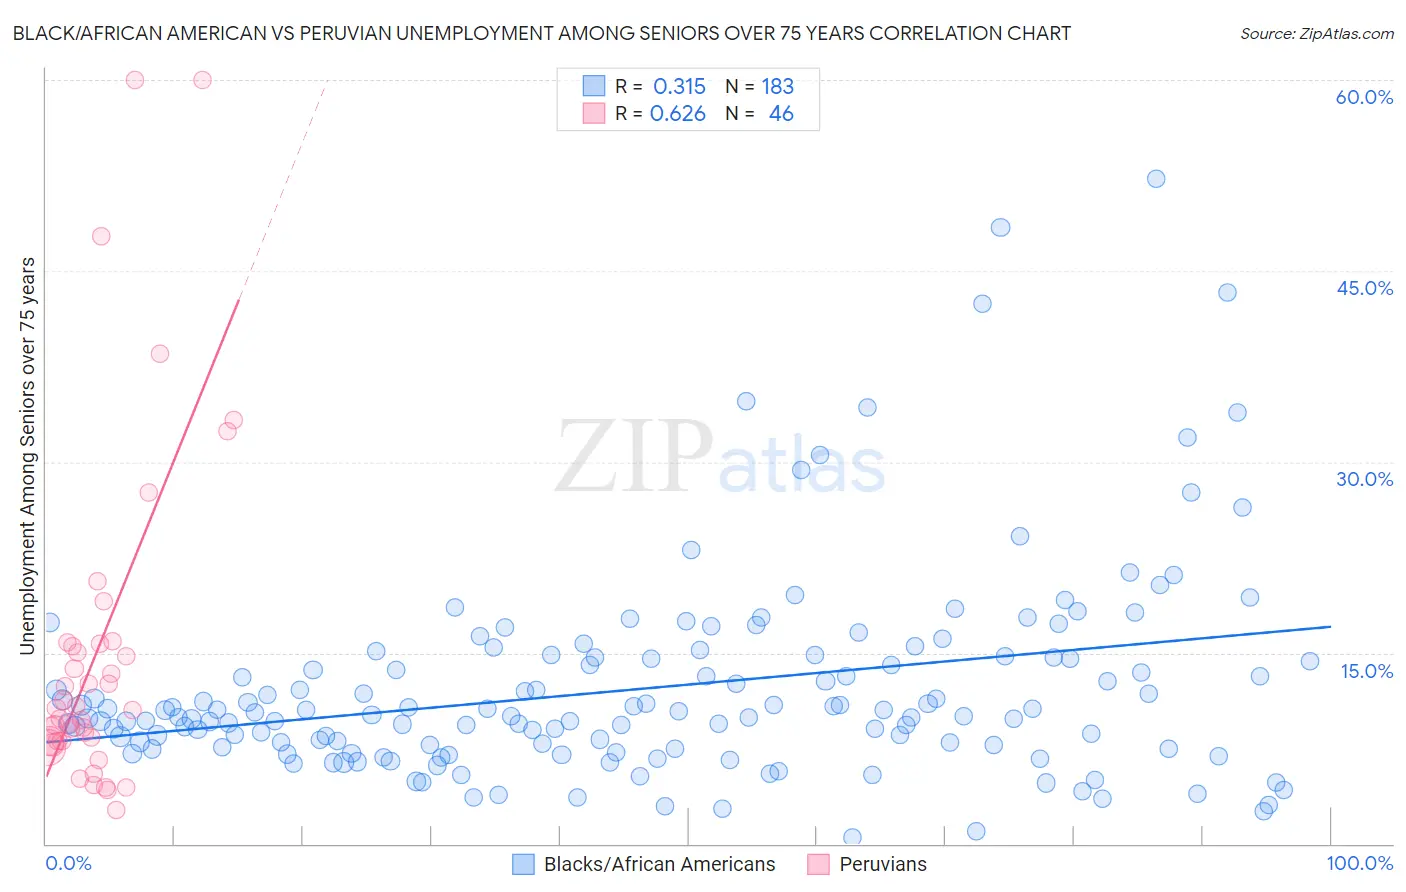
Black/African American vs Peruvian Unemployment Among Seniors over 75 years Correlation Chart
The statistical analysis conducted on geographies consisting of 234,580,439 people shows a mild positive correlation between the proportion of Blacks/African Americans and unemployment rate among seniors over the age of 75 in the United States with a correlation coefficient (R) of 0.315 and weighted average of 9.4%. Similarly, the statistical analysis conducted on geographies consisting of 193,571,064 people shows a significant positive correlation between the proportion of Peruvians and unemployment rate among seniors over the age of 75 in the United States with a correlation coefficient (R) of 0.626 and weighted average of 9.0%, a difference of 3.6%.
Unemployment Among Seniors over 75 years Correlation Summary
| Measurement | Black/African American | Peruvian |
| Minimum | 0.50% | 2.7% |
| Maximum | 52.2% | 60.0% |
| Range | 51.7% | 57.3% |
| Mean | 12.2% | 15.2% |
| Median | 10.2% | 10.6% |
| Interquartile 25% (IQ1) | 7.6% | 8.1% |
| Interquartile 75% (IQ3) | 14.6% | 15.7% |
| Interquartile Range (IQR) | 7.0% | 7.6% |
| Standard Deviation (Sample) | 8.0% | 13.4% |
| Standard Deviation (Population) | 8.0% | 13.2% |
Similar Demographics by Unemployment Among Seniors over 75 years
Demographics Similar to Blacks/African Americans by Unemployment Among Seniors over 75 years
In terms of unemployment among seniors over 75 years, the demographic groups most similar to Blacks/African Americans are Immigrants from Mexico (9.4%, a difference of 0.12%), Greek (9.4%, a difference of 0.28%), Palestinian (9.3%, a difference of 0.32%), Puerto Rican (9.4%, a difference of 0.42%), and Iroquois (9.3%, a difference of 0.45%).
| Demographics | Rating | Rank | Unemployment Among Seniors over 75 years |
| Slovenes | 1.0 /100 | #259 | Tragic 9.3% |
| Immigrants | Cameroon | 1.0 /100 | #260 | Tragic 9.3% |
| Celtics | 0.8 /100 | #261 | Tragic 9.3% |
| Austrians | 0.7 /100 | #262 | Tragic 9.3% |
| Ukrainians | 0.7 /100 | #263 | Tragic 9.3% |
| Iroquois | 0.7 /100 | #264 | Tragic 9.3% |
| Palestinians | 0.6 /100 | #265 | Tragic 9.3% |
| Blacks/African Americans | 0.5 /100 | #266 | Tragic 9.4% |
| Immigrants | Mexico | 0.4 /100 | #267 | Tragic 9.4% |
| Greeks | 0.4 /100 | #268 | Tragic 9.4% |
| Puerto Ricans | 0.3 /100 | #269 | Tragic 9.4% |
| Yaqui | 0.3 /100 | #270 | Tragic 9.4% |
| Bulgarians | 0.3 /100 | #271 | Tragic 9.4% |
| Immigrants | Iraq | 0.3 /100 | #272 | Tragic 9.4% |
| Czechoslovakians | 0.3 /100 | #273 | Tragic 9.4% |
Demographics Similar to Peruvians by Unemployment Among Seniors over 75 years
In terms of unemployment among seniors over 75 years, the demographic groups most similar to Peruvians are Guamanian/Chamorro (9.0%, a difference of 0.070%), Immigrants from Jordan (9.0%, a difference of 0.070%), Immigrants from Zimbabwe (9.0%, a difference of 0.10%), Afghan (9.0%, a difference of 0.18%), and Costa Rican (9.1%, a difference of 0.20%).
| Demographics | Rating | Rank | Unemployment Among Seniors over 75 years |
| Immigrants | Western Asia | 12.5 /100 | #215 | Poor 9.0% |
| Immigrants | Oceania | 11.8 /100 | #216 | Poor 9.0% |
| Lebanese | 11.1 /100 | #217 | Poor 9.0% |
| Immigrants | Africa | 9.7 /100 | #218 | Tragic 9.0% |
| Afghans | 8.3 /100 | #219 | Tragic 9.0% |
| Immigrants | Zimbabwe | 7.8 /100 | #220 | Tragic 9.0% |
| Guamanians/Chamorros | 7.7 /100 | #221 | Tragic 9.0% |
| Peruvians | 7.3 /100 | #222 | Tragic 9.0% |
| Immigrants | Jordan | 6.9 /100 | #223 | Tragic 9.0% |
| Costa Ricans | 6.3 /100 | #224 | Tragic 9.1% |
| Navajo | 6.1 /100 | #225 | Tragic 9.1% |
| Immigrants | Bangladesh | 5.9 /100 | #226 | Tragic 9.1% |
| Samoans | 5.7 /100 | #227 | Tragic 9.1% |
| Kenyans | 5.4 /100 | #228 | Tragic 9.1% |
| Hispanics or Latinos | 5.0 /100 | #229 | Tragic 9.1% |