Immigrants from Eritrea vs Peruvian Householder Income Under 25 years
COMPARE
Immigrants from Eritrea
Peruvian
Householder Income Under 25 years
Householder Income Under 25 years Comparison
Immigrants from Eritrea
Peruvians
$51,574
HOUSEHOLDER INCOME UNDER 25 YEARS
18.1/ 100
METRIC RATING
193rd/ 347
METRIC RANK
$56,052
HOUSEHOLDER INCOME UNDER 25 YEARS
100.0/ 100
METRIC RATING
32nd/ 347
METRIC RANK
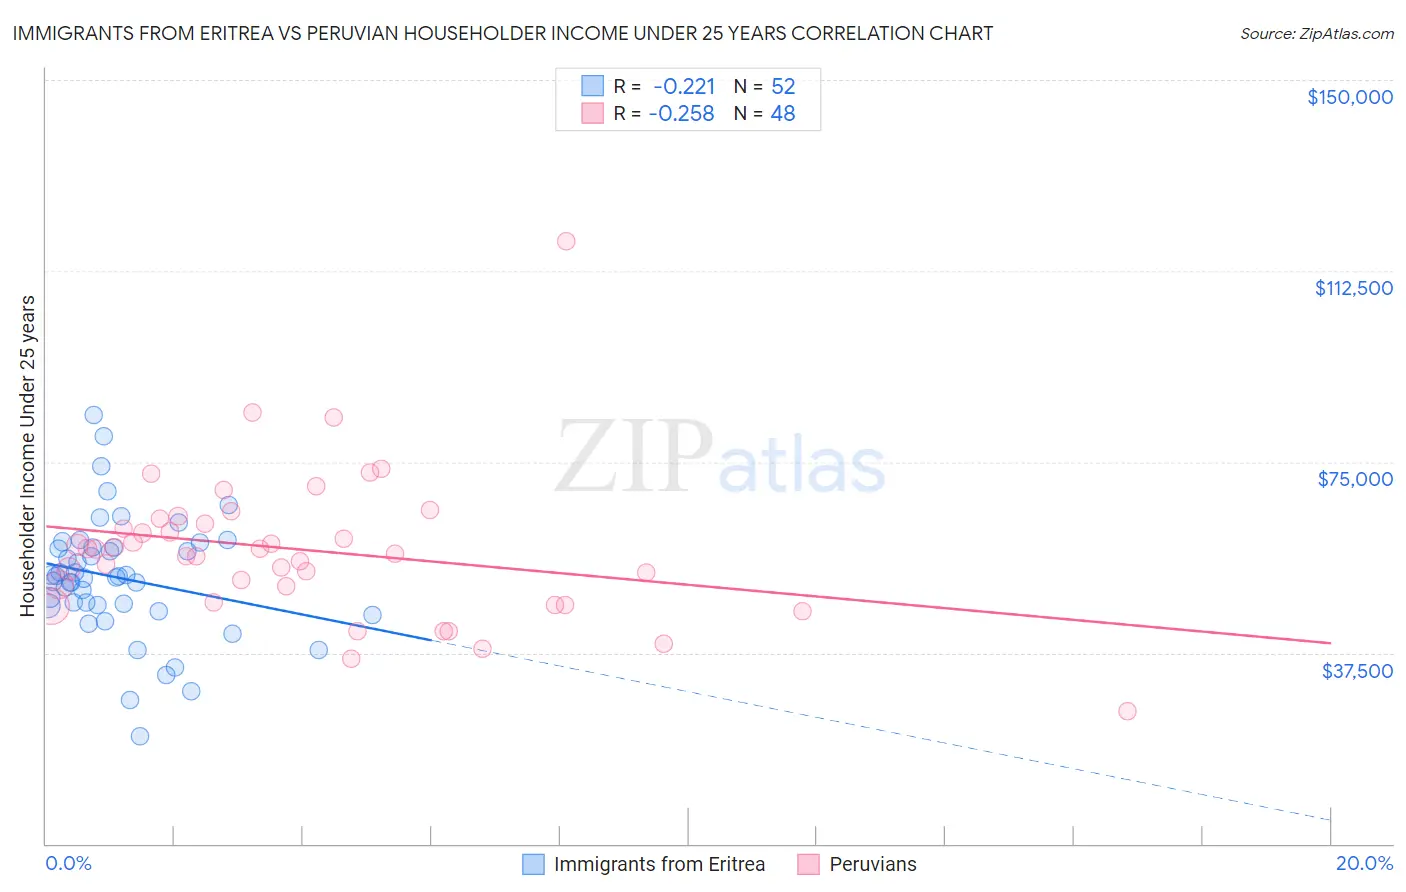
Immigrants from Eritrea vs Peruvian Householder Income Under 25 years Correlation Chart
The statistical analysis conducted on geographies consisting of 99,007,133 people shows a weak negative correlation between the proportion of Immigrants from Eritrea and household income with householder under the age of 25 in the United States with a correlation coefficient (R) of -0.221 and weighted average of $51,574. Similarly, the statistical analysis conducted on geographies consisting of 309,109,247 people shows a weak negative correlation between the proportion of Peruvians and household income with householder under the age of 25 in the United States with a correlation coefficient (R) of -0.258 and weighted average of $56,052, a difference of 8.7%.
Householder Income Under 25 years Correlation Summary
| Measurement | Immigrants from Eritrea | Peruvian |
| Minimum | $21,074 | $25,923 |
| Maximum | $84,198 | $118,438 |
| Range | $63,124 | $92,515 |
| Mean | $52,175 | $57,665 |
| Median | $52,401 | $57,415 |
| Interquartile 25% (IQ1) | $46,767 | $48,987 |
| Interquartile 75% (IQ3) | $58,140 | $63,410 |
| Interquartile Range (IQR) | $11,373 | $14,423 |
| Standard Deviation (Sample) | $11,915 | $14,693 |
| Standard Deviation (Population) | $11,800 | $14,539 |
Similar Demographics by Householder Income Under 25 years
Demographics Similar to Immigrants from Eritrea by Householder Income Under 25 years
In terms of householder income under 25 years, the demographic groups most similar to Immigrants from Eritrea are West Indian ($51,583, a difference of 0.020%), Panamanian ($51,611, a difference of 0.070%), Malaysian ($51,615, a difference of 0.080%), Guatemalan ($51,525, a difference of 0.090%), and Estonian ($51,523, a difference of 0.10%).
| Demographics | Rating | Rank | Householder Income Under 25 years |
| Alaskan Athabascans | 23.8 /100 | #186 | Fair $51,713 |
| Immigrants | South Africa | 23.4 /100 | #187 | Fair $51,705 |
| Northern Europeans | 22.2 /100 | #188 | Fair $51,678 |
| Croatians | 21.6 /100 | #189 | Fair $51,662 |
| Malaysians | 19.7 /100 | #190 | Poor $51,615 |
| Panamanians | 19.5 /100 | #191 | Poor $51,611 |
| West Indians | 18.5 /100 | #192 | Poor $51,583 |
| Immigrants | Eritrea | 18.1 /100 | #193 | Poor $51,574 |
| Guatemalans | 16.4 /100 | #194 | Poor $51,525 |
| Estonians | 16.4 /100 | #195 | Poor $51,523 |
| Palestinians | 16.1 /100 | #196 | Poor $51,515 |
| Pima | 15.7 /100 | #197 | Poor $51,503 |
| Immigrants | Syria | 15.4 /100 | #198 | Poor $51,494 |
| Swiss | 15.4 /100 | #199 | Poor $51,493 |
| Immigrants | West Indies | 14.9 /100 | #200 | Poor $51,479 |
Demographics Similar to Peruvians by Householder Income Under 25 years
In terms of householder income under 25 years, the demographic groups most similar to Peruvians are Vietnamese ($56,127, a difference of 0.13%), Immigrants from Moldova ($56,168, a difference of 0.21%), Inupiat ($55,935, a difference of 0.21%), Immigrants from Japan ($55,932, a difference of 0.21%), and Tlingit-Haida ($55,914, a difference of 0.25%).
| Demographics | Rating | Rank | Householder Income Under 25 years |
| Immigrants | Pakistan | 100.0 /100 | #25 | Exceptional $56,789 |
| Immigrants | Australia | 100.0 /100 | #26 | Exceptional $56,660 |
| Immigrants | North Macedonia | 100.0 /100 | #27 | Exceptional $56,503 |
| Immigrants | Peru | 100.0 /100 | #28 | Exceptional $56,384 |
| Immigrants | Asia | 100.0 /100 | #29 | Exceptional $56,379 |
| Immigrants | Moldova | 100.0 /100 | #30 | Exceptional $56,168 |
| Vietnamese | 100.0 /100 | #31 | Exceptional $56,127 |
| Peruvians | 100.0 /100 | #32 | Exceptional $56,052 |
| Inupiat | 100.0 /100 | #33 | Exceptional $55,935 |
| Immigrants | Japan | 100.0 /100 | #34 | Exceptional $55,932 |
| Tlingit-Haida | 100.0 /100 | #35 | Exceptional $55,914 |
| Immigrants | Israel | 100.0 /100 | #36 | Exceptional $55,913 |
| Immigrants | Russia | 100.0 /100 | #37 | Exceptional $55,891 |
| Immigrants | Iran | 100.0 /100 | #38 | Exceptional $55,880 |
| Immigrants | Belarus | 100.0 /100 | #39 | Exceptional $55,743 |