Portuguese vs Nepalese Householder Income Under 25 years
COMPARE
Portuguese
Nepalese
Householder Income Under 25 years
Householder Income Under 25 years Comparison
Portuguese
Nepalese
$54,436
HOUSEHOLDER INCOME UNDER 25 YEARS
99.6/ 100
METRIC RATING
81st/ 347
METRIC RANK
$54,472
HOUSEHOLDER INCOME UNDER 25 YEARS
99.6/ 100
METRIC RATING
78th/ 347
METRIC RANK
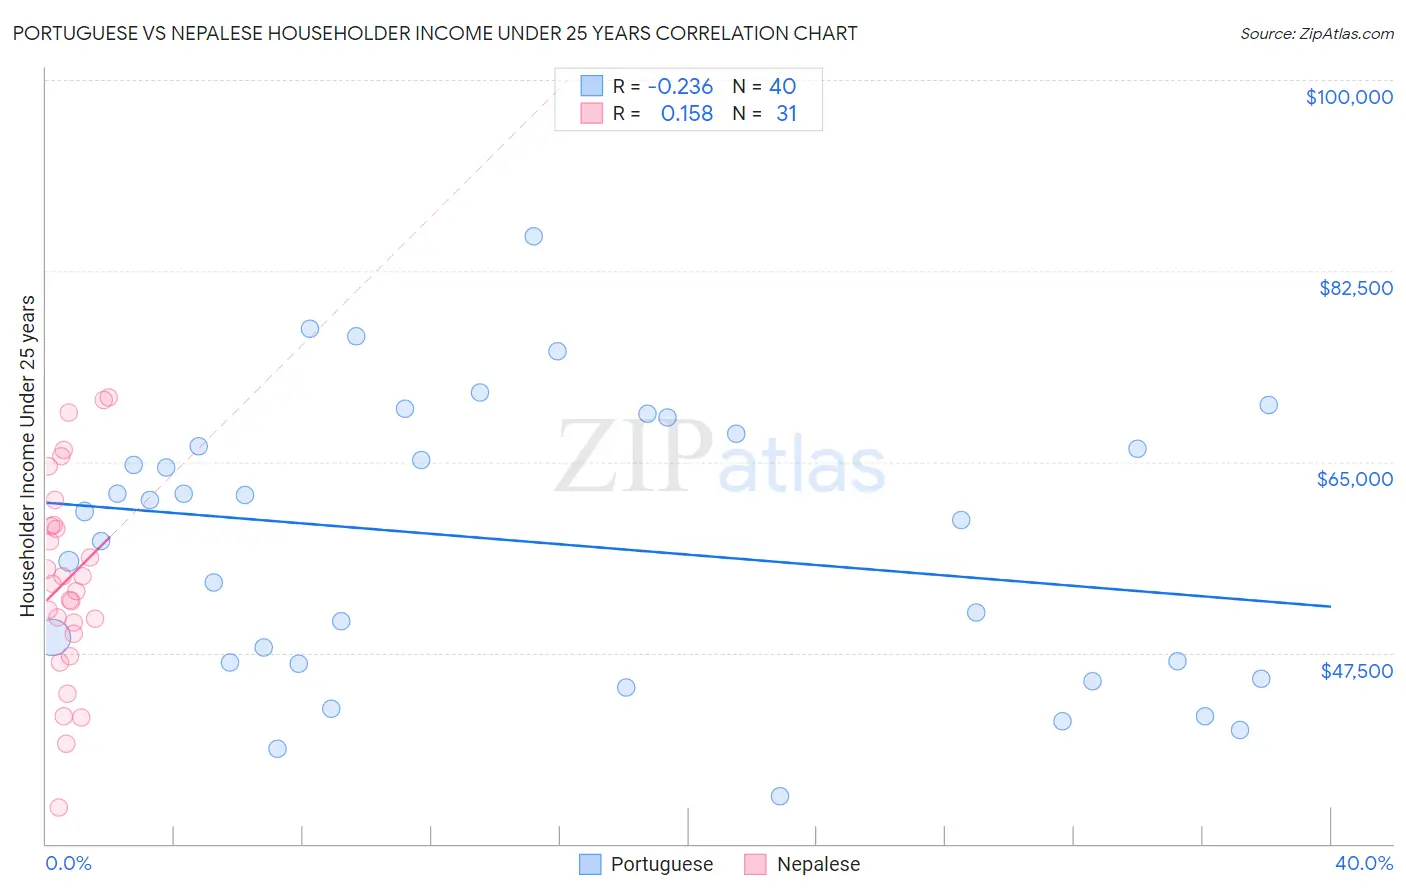
Portuguese vs Nepalese Householder Income Under 25 years Correlation Chart
The statistical analysis conducted on geographies consisting of 369,014,384 people shows a weak negative correlation between the proportion of Portuguese and household income with householder under the age of 25 in the United States with a correlation coefficient (R) of -0.236 and weighted average of $54,436. Similarly, the statistical analysis conducted on geographies consisting of 22,881,746 people shows a poor positive correlation between the proportion of Nepalese and household income with householder under the age of 25 in the United States with a correlation coefficient (R) of 0.158 and weighted average of $54,472, a difference of 0.060%.
Householder Income Under 25 years Correlation Summary
| Measurement | Portuguese | Nepalese |
| Minimum | $34,350 | $33,325 |
| Maximum | $85,677 | $70,914 |
| Range | $51,327 | $37,589 |
| Mean | $57,647 | $54,229 |
| Median | $60,100 | $53,846 |
| Interquartile 25% (IQ1) | $46,553 | $49,219 |
| Interquartile 75% (IQ3) | $67,025 | $59,177 |
| Interquartile Range (IQR) | $20,472 | $9,958 |
| Standard Deviation (Sample) | $12,592 | $9,280 |
| Standard Deviation (Population) | $12,434 | $9,129 |
Demographics Similar to Portuguese and Nepalese by Householder Income Under 25 years
In terms of householder income under 25 years, the demographic groups most similar to Portuguese are Egyptian ($54,444, a difference of 0.010%), Immigrants from Italy ($54,449, a difference of 0.020%), Immigrants from Brazil ($54,487, a difference of 0.090%), Immigrants from Southern Europe ($54,484, a difference of 0.090%), and Russian ($54,389, a difference of 0.090%). Similarly, the demographic groups most similar to Nepalese are Immigrants from Southern Europe ($54,484, a difference of 0.020%), Immigrants from Brazil ($54,487, a difference of 0.030%), Immigrants from Italy ($54,449, a difference of 0.040%), Egyptian ($54,444, a difference of 0.050%), and Immigrants from Sri Lanka ($54,512, a difference of 0.070%).
| Demographics | Rating | Rank | Householder Income Under 25 years |
| Samoans | 99.7 /100 | #69 | Exceptional $54,610 |
| Immigrants | El Salvador | 99.7 /100 | #70 | Exceptional $54,599 |
| Immigrants | Morocco | 99.7 /100 | #71 | Exceptional $54,593 |
| Immigrants | Northern Europe | 99.7 /100 | #72 | Exceptional $54,571 |
| Macedonians | 99.7 /100 | #73 | Exceptional $54,563 |
| Immigrants | Grenada | 99.7 /100 | #74 | Exceptional $54,538 |
| Immigrants | Sri Lanka | 99.7 /100 | #75 | Exceptional $54,512 |
| Immigrants | Brazil | 99.6 /100 | #76 | Exceptional $54,487 |
| Immigrants | Southern Europe | 99.6 /100 | #77 | Exceptional $54,484 |
| Nepalese | 99.6 /100 | #78 | Exceptional $54,472 |
| Immigrants | Italy | 99.6 /100 | #79 | Exceptional $54,449 |
| Egyptians | 99.6 /100 | #80 | Exceptional $54,444 |
| Portuguese | 99.6 /100 | #81 | Exceptional $54,436 |
| Russians | 99.5 /100 | #82 | Exceptional $54,389 |
| Laotians | 99.5 /100 | #83 | Exceptional $54,369 |
| Bulgarians | 99.5 /100 | #84 | Exceptional $54,352 |
| Immigrants | Czechoslovakia | 99.5 /100 | #85 | Exceptional $54,352 |
| Immigrants | Croatia | 99.5 /100 | #86 | Exceptional $54,343 |
| Brazilians | 99.5 /100 | #87 | Exceptional $54,335 |
| Yakama | 99.5 /100 | #88 | Exceptional $54,321 |
| Immigrants | South America | 99.4 /100 | #89 | Exceptional $54,268 |