Black/African American vs Nepalese Disability Age 35 to 64
COMPARE
Black/African American
Nepalese
Disability Age 35 to 64
Disability Age 35 to 64 Comparison
Blacks/African Americans
Nepalese
14.7%
DISABILITY AGE 35 TO 64
0.0/ 100
METRIC RATING
320th/ 347
METRIC RANK
12.8%
DISABILITY AGE 35 TO 64
0.1/ 100
METRIC RATING
271st/ 347
METRIC RANK
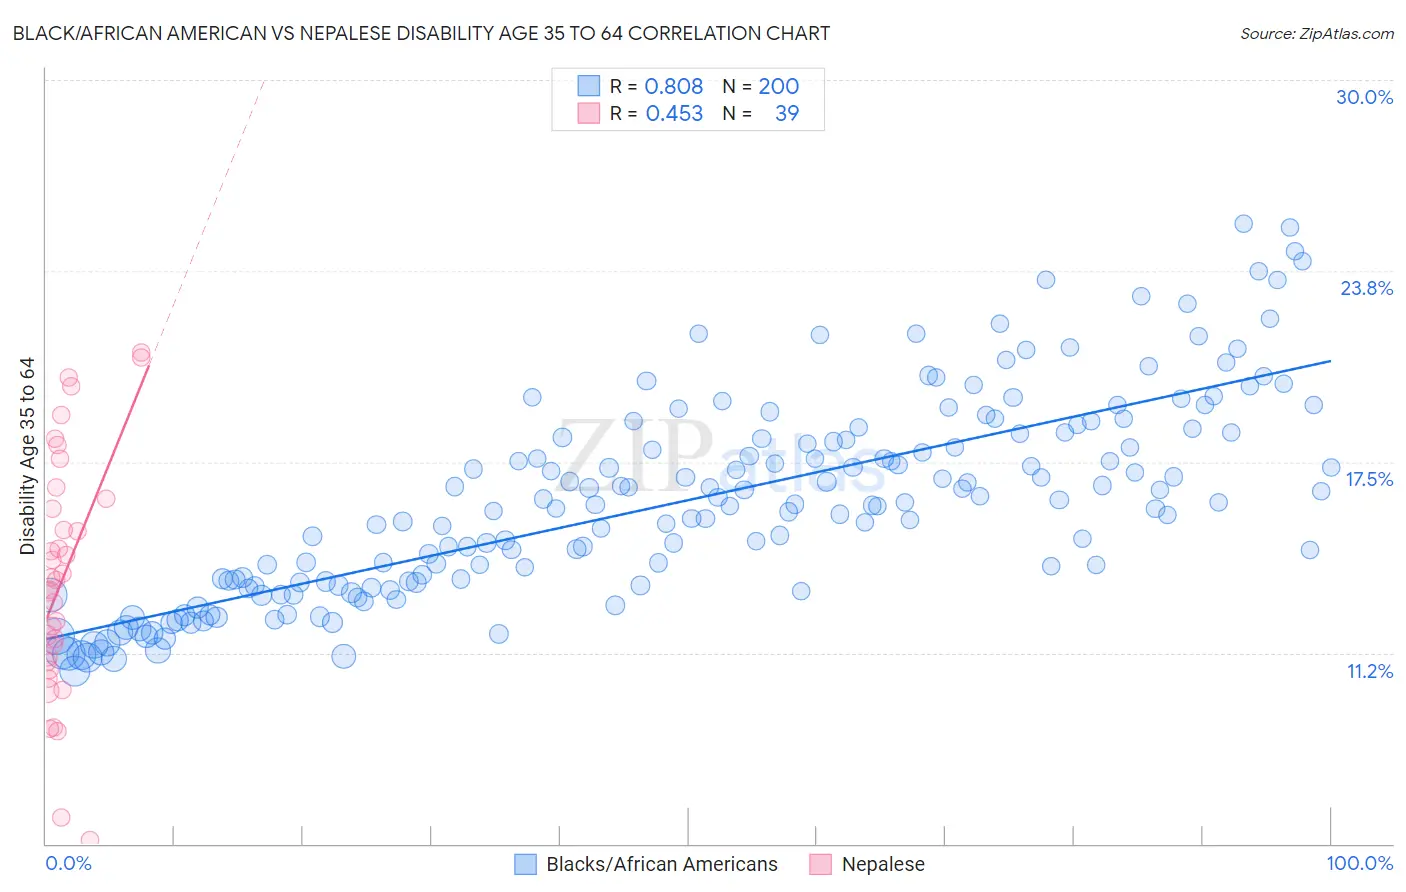
Black/African American vs Nepalese Disability Age 35 to 64 Correlation Chart
The statistical analysis conducted on geographies consisting of 565,040,729 people shows a very strong positive correlation between the proportion of Blacks/African Americans and percentage of population with a disability between the ages 34 and 64 in the United States with a correlation coefficient (R) of 0.808 and weighted average of 14.7%. Similarly, the statistical analysis conducted on geographies consisting of 24,500,920 people shows a moderate positive correlation between the proportion of Nepalese and percentage of population with a disability between the ages 34 and 64 in the United States with a correlation coefficient (R) of 0.453 and weighted average of 12.8%, a difference of 14.7%.
Disability Age 35 to 64 Correlation Summary
| Measurement | Black/African American | Nepalese |
| Minimum | 10.7% | 5.1% |
| Maximum | 25.3% | 21.1% |
| Range | 14.7% | 16.0% |
| Mean | 16.3% | 13.7% |
| Median | 16.1% | 13.6% |
| Interquartile 25% (IQ1) | 13.6% | 10.9% |
| Interquartile 75% (IQ3) | 18.4% | 16.3% |
| Interquartile Range (IQR) | 4.8% | 5.3% |
| Standard Deviation (Sample) | 3.3% | 3.9% |
| Standard Deviation (Population) | 3.3% | 3.9% |
Similar Demographics by Disability Age 35 to 64
Demographics Similar to Blacks/African Americans by Disability Age 35 to 64
In terms of disability age 35 to 64, the demographic groups most similar to Blacks/African Americans are Immigrants from Cabo Verde (14.7%, a difference of 0.15%), Comanche (14.7%, a difference of 0.26%), Potawatomi (14.8%, a difference of 0.30%), Ottawa (14.6%, a difference of 0.57%), and Crow (14.6%, a difference of 0.64%).
| Demographics | Rating | Rank | Disability Age 35 to 64 |
| Iroquois | 0.0 /100 | #313 | Tragic 14.4% |
| Shoshone | 0.0 /100 | #314 | Tragic 14.5% |
| Alaska Natives | 0.0 /100 | #315 | Tragic 14.5% |
| Osage | 0.0 /100 | #316 | Tragic 14.5% |
| Crow | 0.0 /100 | #317 | Tragic 14.6% |
| Ottawa | 0.0 /100 | #318 | Tragic 14.6% |
| Immigrants | Cabo Verde | 0.0 /100 | #319 | Tragic 14.7% |
| Blacks/African Americans | 0.0 /100 | #320 | Tragic 14.7% |
| Comanche | 0.0 /100 | #321 | Tragic 14.7% |
| Potawatomi | 0.0 /100 | #322 | Tragic 14.8% |
| Apache | 0.0 /100 | #323 | Tragic 14.9% |
| Chippewa | 0.0 /100 | #324 | Tragic 15.0% |
| Arapaho | 0.0 /100 | #325 | Tragic 15.1% |
| Natives/Alaskans | 0.0 /100 | #326 | Tragic 15.3% |
| Pueblo | 0.0 /100 | #327 | Tragic 15.3% |
Demographics Similar to Nepalese by Disability Age 35 to 64
In terms of disability age 35 to 64, the demographic groups most similar to Nepalese are U.S. Virgin Islander (12.8%, a difference of 0.12%), Pennsylvania German (12.8%, a difference of 0.21%), Celtic (12.9%, a difference of 0.23%), Dominican (12.9%, a difference of 0.37%), and Somali (12.9%, a difference of 0.49%).
| Demographics | Rating | Rank | Disability Age 35 to 64 |
| Immigrants | Portugal | 0.4 /100 | #264 | Tragic 12.5% |
| Marshallese | 0.4 /100 | #265 | Tragic 12.5% |
| Whites/Caucasians | 0.3 /100 | #266 | Tragic 12.6% |
| Sub-Saharan Africans | 0.2 /100 | #267 | Tragic 12.6% |
| Immigrants | Dominica | 0.2 /100 | #268 | Tragic 12.7% |
| Spanish | 0.2 /100 | #269 | Tragic 12.7% |
| French | 0.2 /100 | #270 | Tragic 12.7% |
| Nepalese | 0.1 /100 | #271 | Tragic 12.8% |
| U.S. Virgin Islanders | 0.1 /100 | #272 | Tragic 12.8% |
| Pennsylvania Germans | 0.1 /100 | #273 | Tragic 12.8% |
| Celtics | 0.1 /100 | #274 | Tragic 12.9% |
| Dominicans | 0.1 /100 | #275 | Tragic 12.9% |
| Somalis | 0.1 /100 | #276 | Tragic 12.9% |
| Immigrants | Dominican Republic | 0.1 /100 | #277 | Tragic 12.9% |
| French Canadians | 0.1 /100 | #278 | Tragic 12.9% |