Chilean vs Danish Householder Income Under 25 years
COMPARE
Chilean
Danish
Householder Income Under 25 years
Householder Income Under 25 years Comparison
Chileans
Danes
$53,185
HOUSEHOLDER INCOME UNDER 25 YEARS
91.9/ 100
METRIC RATING
135th/ 347
METRIC RANK
$53,041
HOUSEHOLDER INCOME UNDER 25 YEARS
88.9/ 100
METRIC RATING
141st/ 347
METRIC RANK
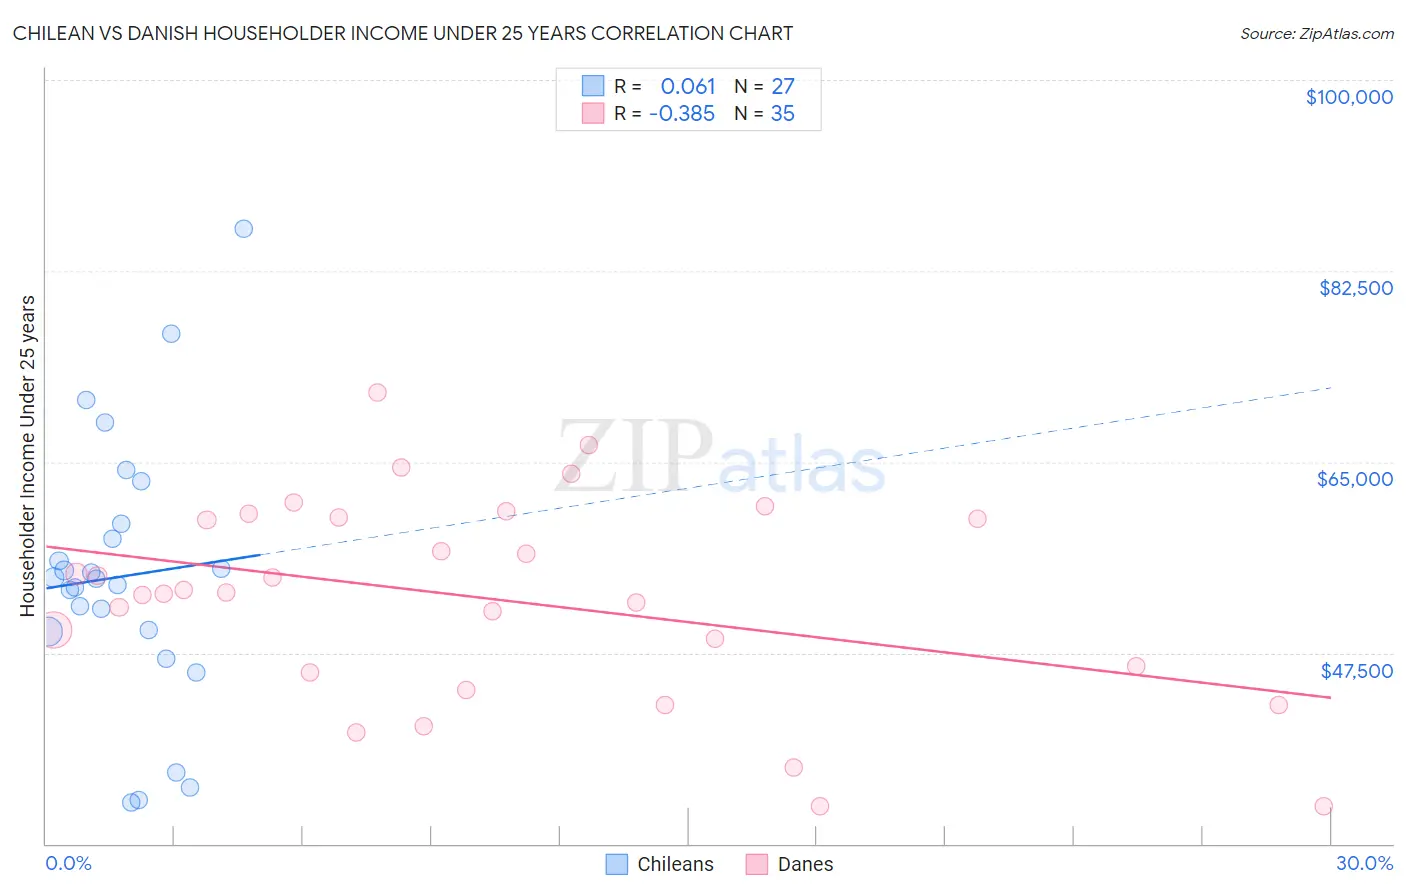
Chilean vs Danish Householder Income Under 25 years Correlation Chart
The statistical analysis conducted on geographies consisting of 225,371,987 people shows a slight positive correlation between the proportion of Chileans and household income with householder under the age of 25 in the United States with a correlation coefficient (R) of 0.061 and weighted average of $53,185. Similarly, the statistical analysis conducted on geographies consisting of 385,598,652 people shows a mild negative correlation between the proportion of Danes and household income with householder under the age of 25 in the United States with a correlation coefficient (R) of -0.385 and weighted average of $53,041, a difference of 0.27%.
Householder Income Under 25 years Correlation Summary
| Measurement | Chilean | Danish |
| Minimum | $33,789 | $33,393 |
| Maximum | $86,333 | $71,390 |
| Range | $52,544 | $37,997 |
| Mean | $54,520 | $52,501 |
| Median | $54,291 | $53,052 |
| Interquartile 25% (IQ1) | $49,428 | $45,744 |
| Interquartile 75% (IQ3) | $59,351 | $59,942 |
| Interquartile Range (IQR) | $9,923 | $14,198 |
| Standard Deviation (Sample) | $12,299 | $9,291 |
| Standard Deviation (Population) | $12,069 | $9,158 |
Demographics Similar to Chileans and Danes by Householder Income Under 25 years
In terms of householder income under 25 years, the demographic groups most similar to Chileans are Immigrants from Northern Africa ($53,185, a difference of 0.0%), Armenian ($53,179, a difference of 0.010%), Immigrants ($53,201, a difference of 0.030%), Immigrants from Barbados ($53,163, a difference of 0.040%), and Norwegian ($53,127, a difference of 0.11%). Similarly, the demographic groups most similar to Danes are Hawaiian ($53,078, a difference of 0.070%), Immigrants from Armenia ($52,986, a difference of 0.10%), Swedish ($52,986, a difference of 0.10%), Costa Rican ($53,106, a difference of 0.12%), and South American Indian ($52,979, a difference of 0.12%).
| Demographics | Rating | Rank | Householder Income Under 25 years |
| Immigrants | Bulgaria | 93.9 /100 | #128 | Exceptional $53,305 |
| New Zealanders | 93.7 /100 | #129 | Exceptional $53,294 |
| Nicaraguans | 93.4 /100 | #130 | Exceptional $53,275 |
| Immigrants | Nicaragua | 93.3 /100 | #131 | Exceptional $53,266 |
| Moroccans | 93.1 /100 | #132 | Exceptional $53,256 |
| Immigrants | Immigrants | 92.2 /100 | #133 | Exceptional $53,201 |
| Immigrants | Northern Africa | 91.9 /100 | #134 | Exceptional $53,185 |
| Chileans | 91.9 /100 | #135 | Exceptional $53,185 |
| Armenians | 91.8 /100 | #136 | Exceptional $53,179 |
| Immigrants | Barbados | 91.5 /100 | #137 | Exceptional $53,163 |
| Norwegians | 90.8 /100 | #138 | Exceptional $53,127 |
| Costa Ricans | 90.4 /100 | #139 | Exceptional $53,106 |
| Hawaiians | 89.8 /100 | #140 | Excellent $53,078 |
| Danes | 88.9 /100 | #141 | Excellent $53,041 |
| Immigrants | Armenia | 87.5 /100 | #142 | Excellent $52,986 |
| Swedes | 87.5 /100 | #143 | Excellent $52,986 |
| South American Indians | 87.3 /100 | #144 | Excellent $52,979 |
| Immigrants | Western Europe | 86.7 /100 | #145 | Excellent $52,957 |
| Immigrants | Hungary | 81.6 /100 | #146 | Excellent $52,798 |
| Latvians | 81.0 /100 | #147 | Excellent $52,783 |
| French Canadians | 76.5 /100 | #148 | Good $52,672 |