Immigrants from Egypt vs Danish Householder Income Under 25 years
COMPARE
Immigrants from Egypt
Danish
Householder Income Under 25 years
Householder Income Under 25 years Comparison
Immigrants from Egypt
Danes
$54,239
HOUSEHOLDER INCOME UNDER 25 YEARS
99.3/ 100
METRIC RATING
91st/ 347
METRIC RANK
$53,041
HOUSEHOLDER INCOME UNDER 25 YEARS
88.9/ 100
METRIC RATING
141st/ 347
METRIC RANK
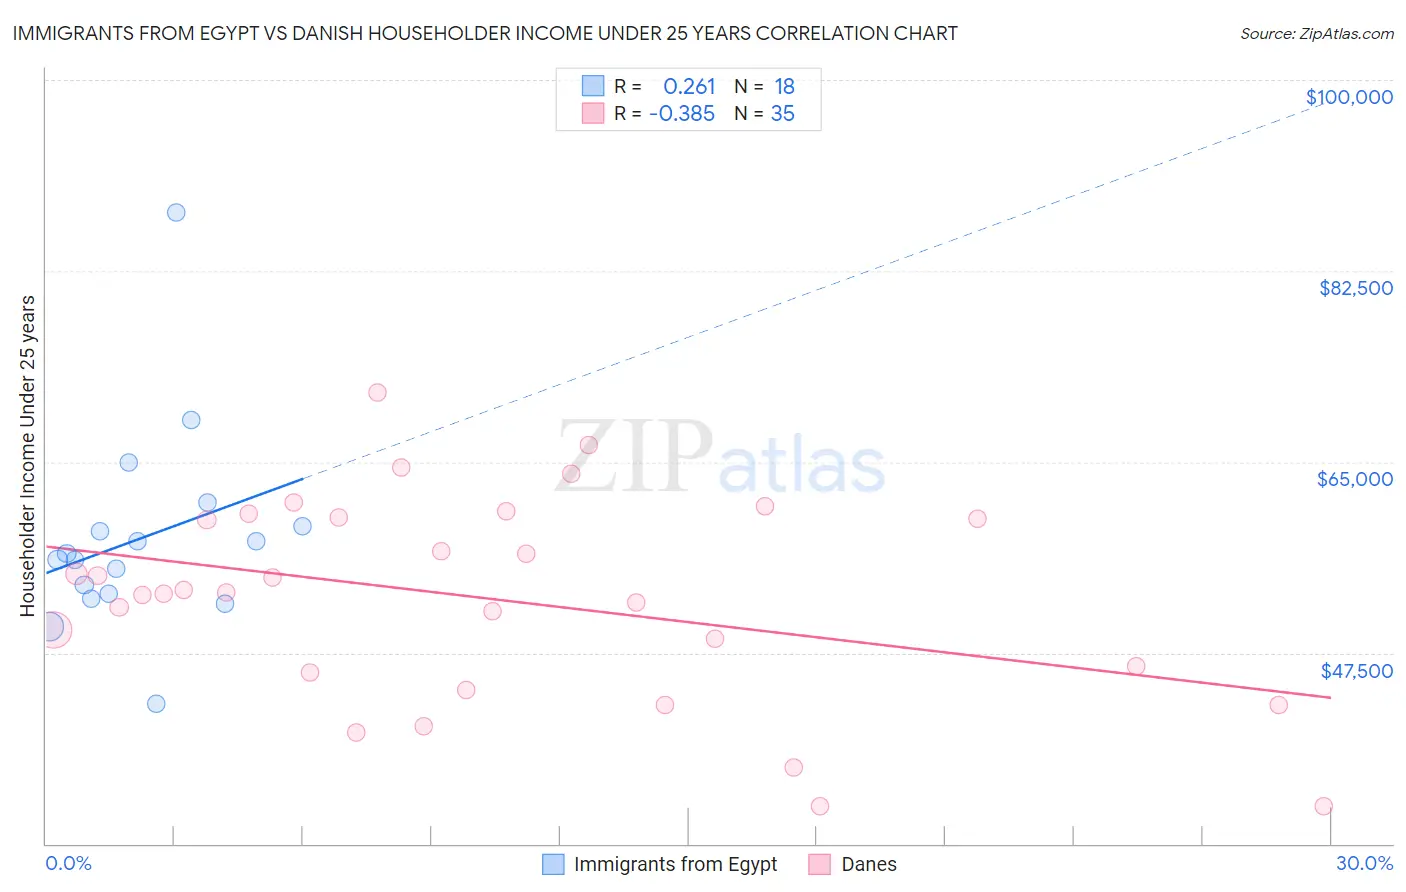
Immigrants from Egypt vs Danish Householder Income Under 25 years Correlation Chart
The statistical analysis conducted on geographies consisting of 213,516,119 people shows a weak positive correlation between the proportion of Immigrants from Egypt and household income with householder under the age of 25 in the United States with a correlation coefficient (R) of 0.261 and weighted average of $54,239. Similarly, the statistical analysis conducted on geographies consisting of 385,598,652 people shows a mild negative correlation between the proportion of Danes and household income with householder under the age of 25 in the United States with a correlation coefficient (R) of -0.385 and weighted average of $53,041, a difference of 2.3%.
Householder Income Under 25 years Correlation Summary
| Measurement | Immigrants from Egypt | Danish |
| Minimum | $42,805 | $33,393 |
| Maximum | $87,806 | $71,390 |
| Range | $45,001 | $37,997 |
| Mean | $57,981 | $52,501 |
| Median | $56,325 | $53,052 |
| Interquartile 25% (IQ1) | $52,891 | $45,744 |
| Interquartile 75% (IQ3) | $59,154 | $59,942 |
| Interquartile Range (IQR) | $6,263 | $14,198 |
| Standard Deviation (Sample) | $9,359 | $9,291 |
| Standard Deviation (Population) | $9,095 | $9,158 |
Similar Demographics by Householder Income Under 25 years
Demographics Similar to Immigrants from Egypt by Householder Income Under 25 years
In terms of householder income under 25 years, the demographic groups most similar to Immigrants from Egypt are Immigrants from St. Vincent and the Grenadines ($54,230, a difference of 0.020%), Immigrants from South America ($54,268, a difference of 0.050%), Turkish ($54,266, a difference of 0.050%), Immigrants from Argentina ($54,209, a difference of 0.050%), and Immigrants from Sierra Leone ($54,190, a difference of 0.090%).
| Demographics | Rating | Rank | Householder Income Under 25 years |
| Bulgarians | 99.5 /100 | #84 | Exceptional $54,352 |
| Immigrants | Czechoslovakia | 99.5 /100 | #85 | Exceptional $54,352 |
| Immigrants | Croatia | 99.5 /100 | #86 | Exceptional $54,343 |
| Brazilians | 99.5 /100 | #87 | Exceptional $54,335 |
| Yakama | 99.5 /100 | #88 | Exceptional $54,321 |
| Immigrants | South America | 99.4 /100 | #89 | Exceptional $54,268 |
| Turks | 99.4 /100 | #90 | Exceptional $54,266 |
| Immigrants | Egypt | 99.3 /100 | #91 | Exceptional $54,239 |
| Immigrants | St. Vincent and the Grenadines | 99.3 /100 | #92 | Exceptional $54,230 |
| Immigrants | Argentina | 99.3 /100 | #93 | Exceptional $54,209 |
| Immigrants | Sierra Leone | 99.3 /100 | #94 | Exceptional $54,190 |
| Immigrants | Malaysia | 99.2 /100 | #95 | Exceptional $54,179 |
| Argentineans | 99.2 /100 | #96 | Exceptional $54,154 |
| Immigrants | Portugal | 99.1 /100 | #97 | Exceptional $54,105 |
| Eastern Europeans | 99.0 /100 | #98 | Exceptional $54,066 |
Demographics Similar to Danes by Householder Income Under 25 years
In terms of householder income under 25 years, the demographic groups most similar to Danes are Hawaiian ($53,078, a difference of 0.070%), Immigrants from Armenia ($52,986, a difference of 0.10%), Swedish ($52,986, a difference of 0.10%), Costa Rican ($53,106, a difference of 0.12%), and South American Indian ($52,979, a difference of 0.12%).
| Demographics | Rating | Rank | Householder Income Under 25 years |
| Immigrants | Northern Africa | 91.9 /100 | #134 | Exceptional $53,185 |
| Chileans | 91.9 /100 | #135 | Exceptional $53,185 |
| Armenians | 91.8 /100 | #136 | Exceptional $53,179 |
| Immigrants | Barbados | 91.5 /100 | #137 | Exceptional $53,163 |
| Norwegians | 90.8 /100 | #138 | Exceptional $53,127 |
| Costa Ricans | 90.4 /100 | #139 | Exceptional $53,106 |
| Hawaiians | 89.8 /100 | #140 | Excellent $53,078 |
| Danes | 88.9 /100 | #141 | Excellent $53,041 |
| Immigrants | Armenia | 87.5 /100 | #142 | Excellent $52,986 |
| Swedes | 87.5 /100 | #143 | Excellent $52,986 |
| South American Indians | 87.3 /100 | #144 | Excellent $52,979 |
| Immigrants | Western Europe | 86.7 /100 | #145 | Excellent $52,957 |
| Immigrants | Hungary | 81.6 /100 | #146 | Excellent $52,798 |
| Latvians | 81.0 /100 | #147 | Excellent $52,783 |
| French Canadians | 76.5 /100 | #148 | Good $52,672 |