Blackfeet vs Bolivian Per Capita Income
COMPARE
Blackfeet
Bolivian
Per Capita Income
Per Capita Income Comparison
Blackfeet
Bolivians
$37,695
PER CAPITA INCOME
0.1/ 100
METRIC RATING
288th/ 347
METRIC RANK
$49,526
PER CAPITA INCOME
99.9/ 100
METRIC RATING
65th/ 347
METRIC RANK
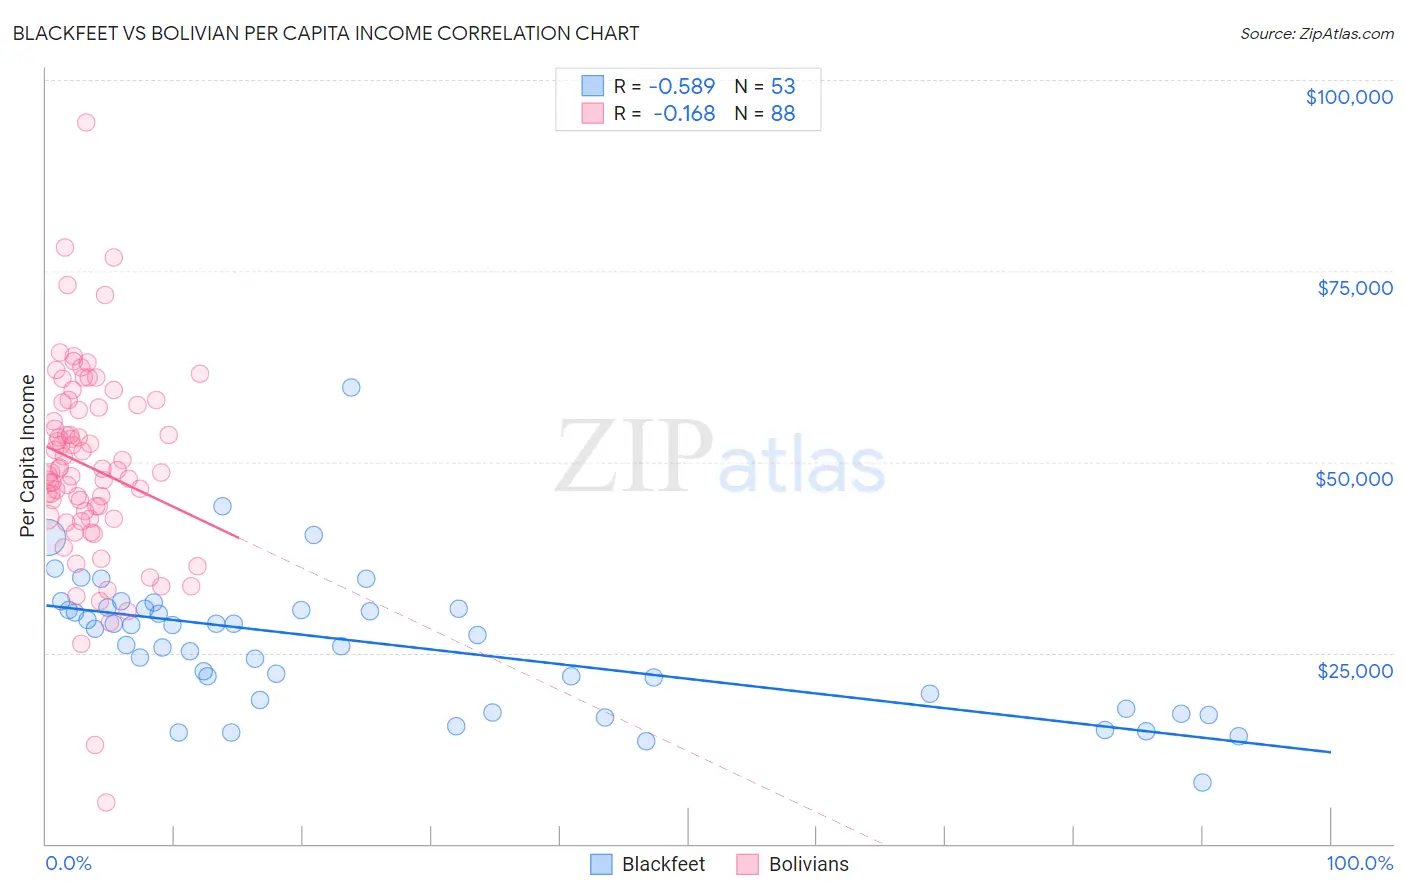
Blackfeet vs Bolivian Per Capita Income Correlation Chart
The statistical analysis conducted on geographies consisting of 309,586,612 people shows a substantial negative correlation between the proportion of Blackfeet and per capita income in the United States with a correlation coefficient (R) of -0.589 and weighted average of $37,695. Similarly, the statistical analysis conducted on geographies consisting of 184,684,256 people shows a poor negative correlation between the proportion of Bolivians and per capita income in the United States with a correlation coefficient (R) of -0.168 and weighted average of $49,526, a difference of 31.4%.
Per Capita Income Correlation Summary
| Measurement | Blackfeet | Bolivian |
| Minimum | $7,946 | $5,324 |
| Maximum | $59,700 | $94,448 |
| Range | $51,754 | $89,124 |
| Mean | $26,182 | $49,375 |
| Median | $27,256 | $48,769 |
| Interquartile 25% (IQ1) | $18,286 | $42,691 |
| Interquartile 75% (IQ3) | $30,810 | $57,269 |
| Interquartile Range (IQR) | $12,524 | $14,578 |
| Standard Deviation (Sample) | $9,146 | $13,010 |
| Standard Deviation (Population) | $9,059 | $12,935 |
Similar Demographics by Per Capita Income
Demographics Similar to Blackfeet by Per Capita Income
In terms of per capita income, the demographic groups most similar to Blackfeet are Dominican ($37,697, a difference of 0.0%), Central American Indian ($37,699, a difference of 0.010%), Guatemalan ($37,766, a difference of 0.19%), African ($37,785, a difference of 0.24%), and U.S. Virgin Islander ($37,589, a difference of 0.28%).
| Demographics | Rating | Rank | Per Capita Income |
| Immigrants | Dominica | 0.2 /100 | #281 | Tragic $37,952 |
| Immigrants | Laos | 0.1 /100 | #282 | Tragic $37,857 |
| Pennsylvania Germans | 0.1 /100 | #283 | Tragic $37,842 |
| Africans | 0.1 /100 | #284 | Tragic $37,785 |
| Guatemalans | 0.1 /100 | #285 | Tragic $37,766 |
| Central American Indians | 0.1 /100 | #286 | Tragic $37,699 |
| Dominicans | 0.1 /100 | #287 | Tragic $37,697 |
| Blackfeet | 0.1 /100 | #288 | Tragic $37,695 |
| U.S. Virgin Islanders | 0.1 /100 | #289 | Tragic $37,589 |
| Immigrants | Guatemala | 0.1 /100 | #290 | Tragic $37,550 |
| Cajuns | 0.1 /100 | #291 | Tragic $37,527 |
| Immigrants | Micronesia | 0.1 /100 | #292 | Tragic $37,464 |
| Mexican American Indians | 0.1 /100 | #293 | Tragic $37,407 |
| Cubans | 0.1 /100 | #294 | Tragic $37,383 |
| Immigrants | Dominican Republic | 0.1 /100 | #295 | Tragic $37,306 |
Demographics Similar to Bolivians by Per Capita Income
In terms of per capita income, the demographic groups most similar to Bolivians are Immigrants from Bulgaria ($49,482, a difference of 0.090%), Immigrants from Romania ($49,463, a difference of 0.13%), Lithuanian ($49,448, a difference of 0.16%), Immigrants from Argentina ($49,627, a difference of 0.20%), and Maltese ($49,640, a difference of 0.23%).
| Demographics | Rating | Rank | Per Capita Income |
| Immigrants | Malaysia | 99.9 /100 | #58 | Exceptional $49,983 |
| Bhutanese | 99.9 /100 | #59 | Exceptional $49,894 |
| Immigrants | Scotland | 99.9 /100 | #60 | Exceptional $49,893 |
| Argentineans | 99.9 /100 | #61 | Exceptional $49,862 |
| Immigrants | Asia | 99.9 /100 | #62 | Exceptional $49,741 |
| Maltese | 99.9 /100 | #63 | Exceptional $49,640 |
| Immigrants | Argentina | 99.9 /100 | #64 | Exceptional $49,627 |
| Bolivians | 99.9 /100 | #65 | Exceptional $49,526 |
| Immigrants | Bulgaria | 99.9 /100 | #66 | Exceptional $49,482 |
| Immigrants | Romania | 99.9 /100 | #67 | Exceptional $49,463 |
| Lithuanians | 99.8 /100 | #68 | Exceptional $49,448 |
| Immigrants | Canada | 99.8 /100 | #69 | Exceptional $49,412 |
| Immigrants | Eastern Europe | 99.8 /100 | #70 | Exceptional $49,316 |
| Greeks | 99.8 /100 | #71 | Exceptional $49,309 |
| Immigrants | Hungary | 99.8 /100 | #72 | Exceptional $49,303 |