Immigrants from Latvia vs Bolivian Per Capita Income
COMPARE
Immigrants from Latvia
Bolivian
Per Capita Income
Per Capita Income Comparison
Immigrants from Latvia
Bolivians
$50,914
PER CAPITA INCOME
100.0/ 100
METRIC RATING
46th/ 347
METRIC RANK
$49,526
PER CAPITA INCOME
99.9/ 100
METRIC RATING
65th/ 347
METRIC RANK
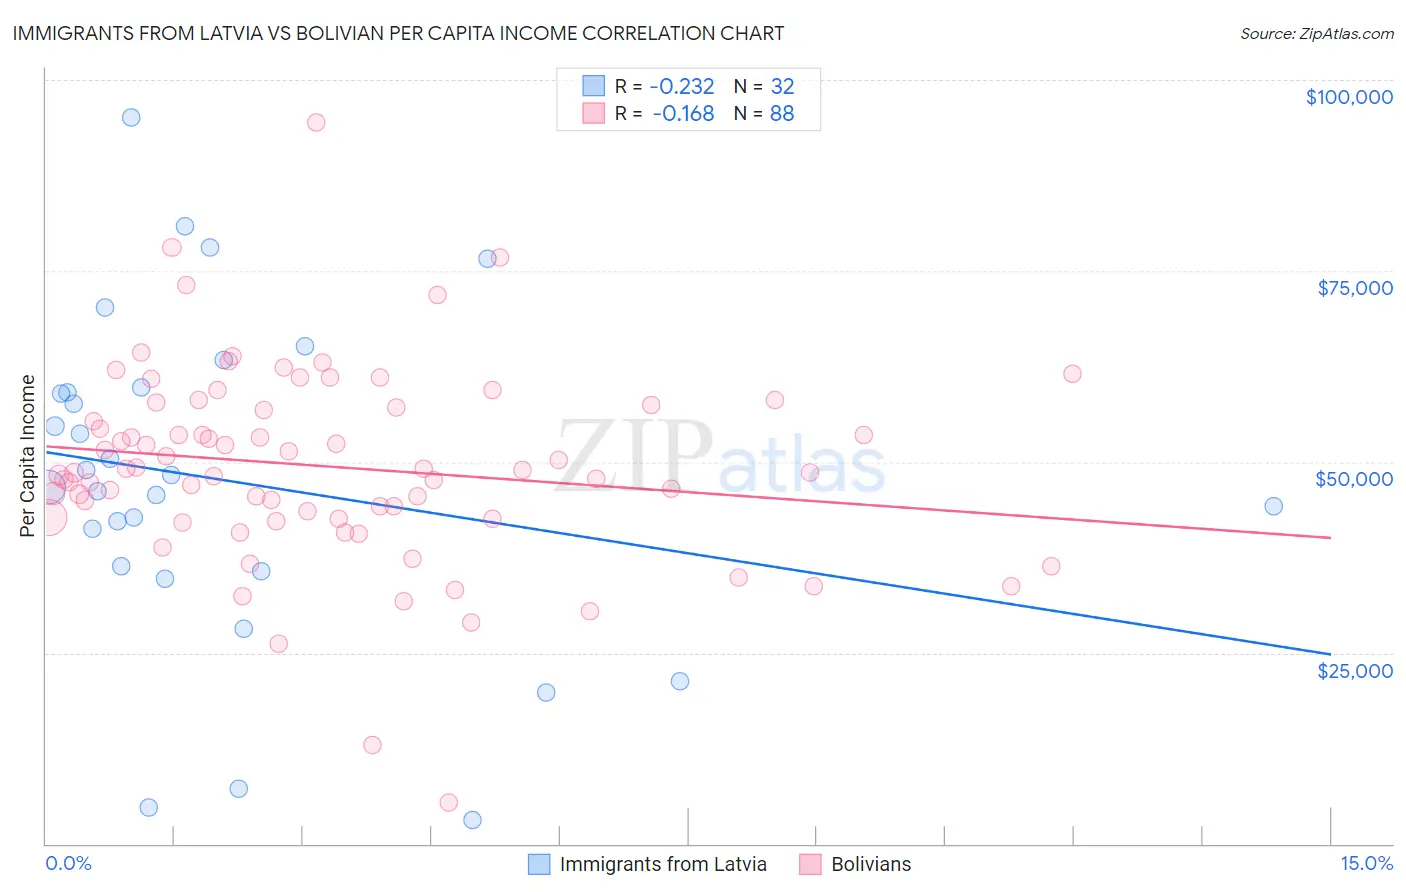
Immigrants from Latvia vs Bolivian Per Capita Income Correlation Chart
The statistical analysis conducted on geographies consisting of 113,739,608 people shows a weak negative correlation between the proportion of Immigrants from Latvia and per capita income in the United States with a correlation coefficient (R) of -0.232 and weighted average of $50,914. Similarly, the statistical analysis conducted on geographies consisting of 184,684,256 people shows a poor negative correlation between the proportion of Bolivians and per capita income in the United States with a correlation coefficient (R) of -0.168 and weighted average of $49,526, a difference of 2.8%.
Per Capita Income Correlation Summary
| Measurement | Immigrants from Latvia | Bolivian |
| Minimum | $3,055 | $5,324 |
| Maximum | $95,062 | $94,448 |
| Range | $92,007 | $89,124 |
| Mean | $47,518 | $49,375 |
| Median | $47,530 | $48,769 |
| Interquartile 25% (IQ1) | $35,985 | $42,691 |
| Interquartile 75% (IQ3) | $59,433 | $57,269 |
| Interquartile Range (IQR) | $23,448 | $14,578 |
| Standard Deviation (Sample) | $21,734 | $13,010 |
| Standard Deviation (Population) | $21,392 | $12,935 |
Demographics Similar to Immigrants from Latvia and Bolivians by Per Capita Income
In terms of per capita income, the demographic groups most similar to Immigrants from Latvia are Bulgarian ($50,906, a difference of 0.020%), Immigrants from Spain ($50,933, a difference of 0.040%), Immigrants from Serbia ($50,810, a difference of 0.21%), New Zealander ($50,575, a difference of 0.67%), and Immigrants from Sri Lanka ($50,555, a difference of 0.71%). Similarly, the demographic groups most similar to Bolivians are Immigrants from Argentina ($49,627, a difference of 0.20%), Maltese ($49,640, a difference of 0.23%), Immigrants from Asia ($49,741, a difference of 0.43%), Argentinean ($49,862, a difference of 0.68%), and Bhutanese ($49,894, a difference of 0.74%).
| Demographics | Rating | Rank | Per Capita Income |
| Immigrants | Spain | 100.0 /100 | #45 | Exceptional $50,933 |
| Immigrants | Latvia | 100.0 /100 | #46 | Exceptional $50,914 |
| Bulgarians | 100.0 /100 | #47 | Exceptional $50,906 |
| Immigrants | Serbia | 100.0 /100 | #48 | Exceptional $50,810 |
| New Zealanders | 100.0 /100 | #49 | Exceptional $50,575 |
| Immigrants | Sri Lanka | 100.0 /100 | #50 | Exceptional $50,555 |
| Immigrants | Netherlands | 100.0 /100 | #51 | Exceptional $50,458 |
| Immigrants | Croatia | 99.9 /100 | #52 | Exceptional $50,417 |
| Paraguayans | 99.9 /100 | #53 | Exceptional $50,385 |
| Immigrants | Belarus | 99.9 /100 | #54 | Exceptional $50,303 |
| Immigrants | Western Europe | 99.9 /100 | #55 | Exceptional $50,065 |
| Asians | 99.9 /100 | #56 | Exceptional $50,057 |
| South Africans | 99.9 /100 | #57 | Exceptional $50,044 |
| Immigrants | Malaysia | 99.9 /100 | #58 | Exceptional $49,983 |
| Bhutanese | 99.9 /100 | #59 | Exceptional $49,894 |
| Immigrants | Scotland | 99.9 /100 | #60 | Exceptional $49,893 |
| Argentineans | 99.9 /100 | #61 | Exceptional $49,862 |
| Immigrants | Asia | 99.9 /100 | #62 | Exceptional $49,741 |
| Maltese | 99.9 /100 | #63 | Exceptional $49,640 |
| Immigrants | Argentina | 99.9 /100 | #64 | Exceptional $49,627 |
| Bolivians | 99.9 /100 | #65 | Exceptional $49,526 |