Blackfeet vs Black/African American Per Capita Income
COMPARE
Blackfeet
Black/African American
Per Capita Income
Per Capita Income Comparison
Blackfeet
Blacks/African Americans
$37,695
PER CAPITA INCOME
0.1/ 100
METRIC RATING
288th/ 347
METRIC RANK
$35,564
PER CAPITA INCOME
0.0/ 100
METRIC RATING
321st/ 347
METRIC RANK
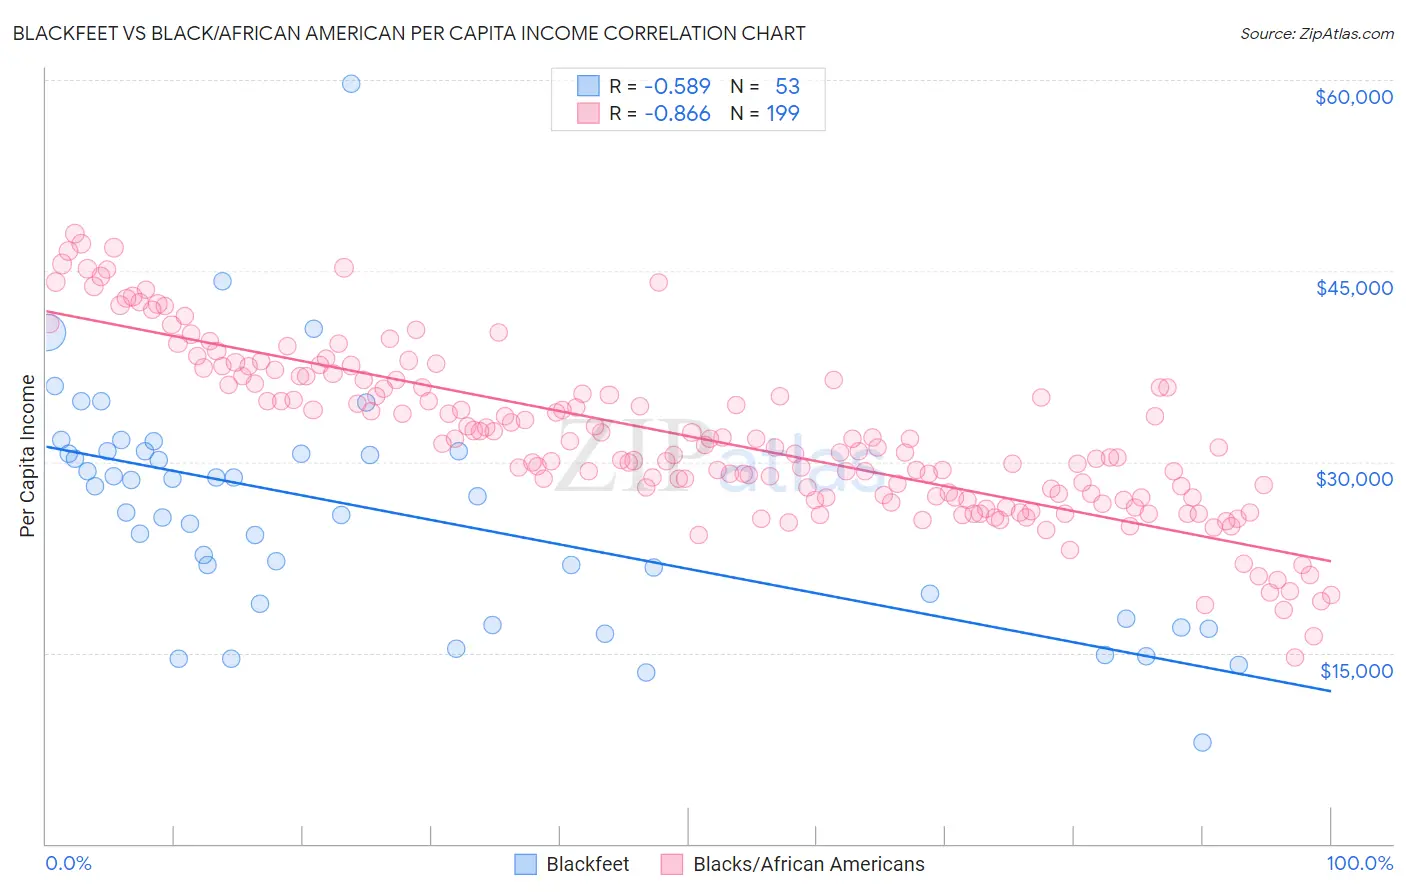
Blackfeet vs Black/African American Per Capita Income Correlation Chart
The statistical analysis conducted on geographies consisting of 309,586,612 people shows a substantial negative correlation between the proportion of Blackfeet and per capita income in the United States with a correlation coefficient (R) of -0.589 and weighted average of $37,695. Similarly, the statistical analysis conducted on geographies consisting of 564,923,865 people shows a very strong negative correlation between the proportion of Blacks/African Americans and per capita income in the United States with a correlation coefficient (R) of -0.866 and weighted average of $35,564, a difference of 6.0%.
Per Capita Income Correlation Summary
| Measurement | Blackfeet | Black/African American |
| Minimum | $7,946 | $14,598 |
| Maximum | $59,700 | $47,964 |
| Range | $51,754 | $33,366 |
| Mean | $26,182 | $32,008 |
| Median | $27,256 | $31,154 |
| Interquartile 25% (IQ1) | $18,286 | $27,216 |
| Interquartile 75% (IQ3) | $30,810 | $36,450 |
| Interquartile Range (IQR) | $12,524 | $9,234 |
| Standard Deviation (Sample) | $9,146 | $6,581 |
| Standard Deviation (Population) | $9,059 | $6,564 |
Similar Demographics by Per Capita Income
Demographics Similar to Blackfeet by Per Capita Income
In terms of per capita income, the demographic groups most similar to Blackfeet are Dominican ($37,697, a difference of 0.0%), Central American Indian ($37,699, a difference of 0.010%), Guatemalan ($37,766, a difference of 0.19%), African ($37,785, a difference of 0.24%), and U.S. Virgin Islander ($37,589, a difference of 0.28%).
| Demographics | Rating | Rank | Per Capita Income |
| Immigrants | Dominica | 0.2 /100 | #281 | Tragic $37,952 |
| Immigrants | Laos | 0.1 /100 | #282 | Tragic $37,857 |
| Pennsylvania Germans | 0.1 /100 | #283 | Tragic $37,842 |
| Africans | 0.1 /100 | #284 | Tragic $37,785 |
| Guatemalans | 0.1 /100 | #285 | Tragic $37,766 |
| Central American Indians | 0.1 /100 | #286 | Tragic $37,699 |
| Dominicans | 0.1 /100 | #287 | Tragic $37,697 |
| Blackfeet | 0.1 /100 | #288 | Tragic $37,695 |
| U.S. Virgin Islanders | 0.1 /100 | #289 | Tragic $37,589 |
| Immigrants | Guatemala | 0.1 /100 | #290 | Tragic $37,550 |
| Cajuns | 0.1 /100 | #291 | Tragic $37,527 |
| Immigrants | Micronesia | 0.1 /100 | #292 | Tragic $37,464 |
| Mexican American Indians | 0.1 /100 | #293 | Tragic $37,407 |
| Cubans | 0.1 /100 | #294 | Tragic $37,383 |
| Immigrants | Dominican Republic | 0.1 /100 | #295 | Tragic $37,306 |
Demographics Similar to Blacks/African Americans by Per Capita Income
In terms of per capita income, the demographic groups most similar to Blacks/African Americans are Creek ($35,546, a difference of 0.050%), Hispanic or Latino ($35,688, a difference of 0.35%), Immigrants from Congo ($35,720, a difference of 0.44%), Cheyenne ($35,276, a difference of 0.82%), and Bangladeshi ($35,897, a difference of 0.94%).
| Demographics | Rating | Rank | Per Capita Income |
| Seminole | 0.0 /100 | #314 | Tragic $36,180 |
| Yaqui | 0.0 /100 | #315 | Tragic $36,112 |
| Choctaw | 0.0 /100 | #316 | Tragic $35,999 |
| Dutch West Indians | 0.0 /100 | #317 | Tragic $35,922 |
| Bangladeshis | 0.0 /100 | #318 | Tragic $35,897 |
| Immigrants | Congo | 0.0 /100 | #319 | Tragic $35,720 |
| Hispanics or Latinos | 0.0 /100 | #320 | Tragic $35,688 |
| Blacks/African Americans | 0.0 /100 | #321 | Tragic $35,564 |
| Creek | 0.0 /100 | #322 | Tragic $35,546 |
| Cheyenne | 0.0 /100 | #323 | Tragic $35,276 |
| Kiowa | 0.0 /100 | #324 | Tragic $35,102 |
| Immigrants | Central America | 0.0 /100 | #325 | Tragic $34,974 |
| Immigrants | Cuba | 0.0 /100 | #326 | Tragic $34,910 |
| Apache | 0.0 /100 | #327 | Tragic $34,886 |
| Menominee | 0.0 /100 | #328 | Tragic $34,578 |