Immigrants from Argentina vs Bolivian Per Capita Income
COMPARE
Immigrants from Argentina
Bolivian
Per Capita Income
Per Capita Income Comparison
Immigrants from Argentina
Bolivians
$49,627
PER CAPITA INCOME
99.9/ 100
METRIC RATING
64th/ 347
METRIC RANK
$49,526
PER CAPITA INCOME
99.9/ 100
METRIC RATING
65th/ 347
METRIC RANK
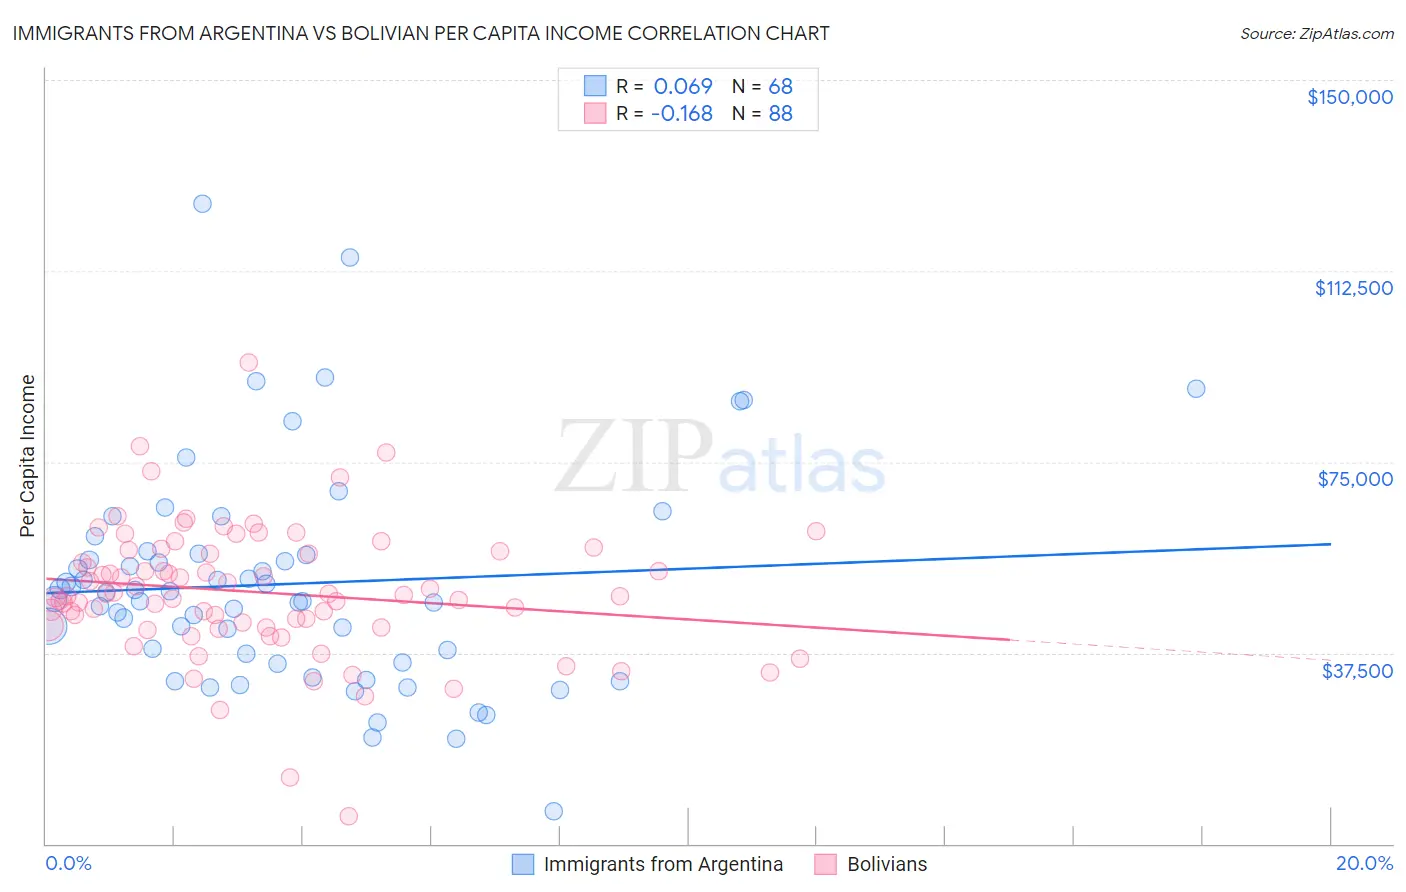
Immigrants from Argentina vs Bolivian Per Capita Income Correlation Chart
The statistical analysis conducted on geographies consisting of 264,438,412 people shows a slight positive correlation between the proportion of Immigrants from Argentina and per capita income in the United States with a correlation coefficient (R) of 0.069 and weighted average of $49,627. Similarly, the statistical analysis conducted on geographies consisting of 184,684,256 people shows a poor negative correlation between the proportion of Bolivians and per capita income in the United States with a correlation coefficient (R) of -0.168 and weighted average of $49,526, a difference of 0.20%.
Per Capita Income Correlation Summary
| Measurement | Immigrants from Argentina | Bolivian |
| Minimum | $6,333 | $5,324 |
| Maximum | $125,688 | $94,448 |
| Range | $119,355 | $89,124 |
| Mean | $51,000 | $49,375 |
| Median | $48,720 | $48,769 |
| Interquartile 25% (IQ1) | $36,471 | $42,691 |
| Interquartile 75% (IQ3) | $56,811 | $57,269 |
| Interquartile Range (IQR) | $20,340 | $14,578 |
| Standard Deviation (Sample) | $21,495 | $13,010 |
| Standard Deviation (Population) | $21,336 | $12,935 |
Demographics Similar to Immigrants from Argentina and Bolivians by Per Capita Income
In terms of per capita income, the demographic groups most similar to Immigrants from Argentina are Maltese ($49,640, a difference of 0.030%), Immigrants from Asia ($49,741, a difference of 0.23%), Immigrants from Bulgaria ($49,482, a difference of 0.29%), Immigrants from Romania ($49,463, a difference of 0.33%), and Lithuanian ($49,448, a difference of 0.36%). Similarly, the demographic groups most similar to Bolivians are Immigrants from Bulgaria ($49,482, a difference of 0.090%), Immigrants from Romania ($49,463, a difference of 0.13%), Lithuanian ($49,448, a difference of 0.16%), Maltese ($49,640, a difference of 0.23%), and Immigrants from Canada ($49,412, a difference of 0.23%).
| Demographics | Rating | Rank | Per Capita Income |
| Immigrants | Belarus | 99.9 /100 | #54 | Exceptional $50,303 |
| Immigrants | Western Europe | 99.9 /100 | #55 | Exceptional $50,065 |
| Asians | 99.9 /100 | #56 | Exceptional $50,057 |
| South Africans | 99.9 /100 | #57 | Exceptional $50,044 |
| Immigrants | Malaysia | 99.9 /100 | #58 | Exceptional $49,983 |
| Bhutanese | 99.9 /100 | #59 | Exceptional $49,894 |
| Immigrants | Scotland | 99.9 /100 | #60 | Exceptional $49,893 |
| Argentineans | 99.9 /100 | #61 | Exceptional $49,862 |
| Immigrants | Asia | 99.9 /100 | #62 | Exceptional $49,741 |
| Maltese | 99.9 /100 | #63 | Exceptional $49,640 |
| Immigrants | Argentina | 99.9 /100 | #64 | Exceptional $49,627 |
| Bolivians | 99.9 /100 | #65 | Exceptional $49,526 |
| Immigrants | Bulgaria | 99.9 /100 | #66 | Exceptional $49,482 |
| Immigrants | Romania | 99.9 /100 | #67 | Exceptional $49,463 |
| Lithuanians | 99.8 /100 | #68 | Exceptional $49,448 |
| Immigrants | Canada | 99.8 /100 | #69 | Exceptional $49,412 |
| Immigrants | Eastern Europe | 99.8 /100 | #70 | Exceptional $49,316 |
| Greeks | 99.8 /100 | #71 | Exceptional $49,309 |
| Immigrants | Hungary | 99.8 /100 | #72 | Exceptional $49,303 |
| Immigrants | North America | 99.8 /100 | #73 | Exceptional $49,302 |
| Mongolians | 99.8 /100 | #74 | Exceptional $49,173 |