Blackfeet vs Ukrainian Per Capita Income
COMPARE
Blackfeet
Ukrainian
Per Capita Income
Per Capita Income Comparison
Blackfeet
Ukrainians
$37,695
PER CAPITA INCOME
0.1/ 100
METRIC RATING
288th/ 347
METRIC RANK
$48,014
PER CAPITA INCOME
99.3/ 100
METRIC RATING
87th/ 347
METRIC RANK
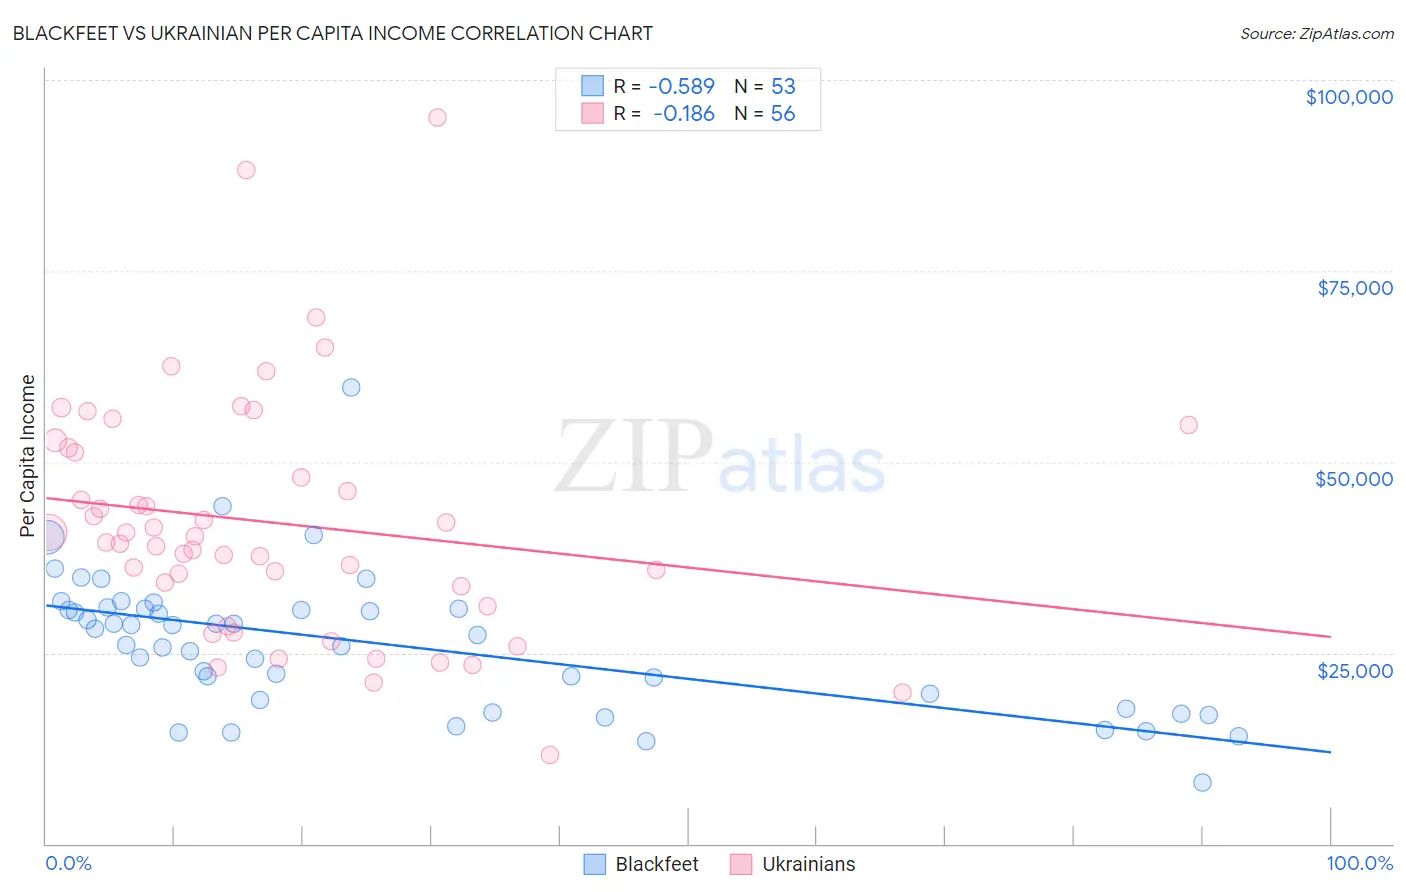
Blackfeet vs Ukrainian Per Capita Income Correlation Chart
The statistical analysis conducted on geographies consisting of 309,586,612 people shows a substantial negative correlation between the proportion of Blackfeet and per capita income in the United States with a correlation coefficient (R) of -0.589 and weighted average of $37,695. Similarly, the statistical analysis conducted on geographies consisting of 448,721,179 people shows a poor negative correlation between the proportion of Ukrainians and per capita income in the United States with a correlation coefficient (R) of -0.186 and weighted average of $48,014, a difference of 27.4%.
Per Capita Income Correlation Summary
| Measurement | Blackfeet | Ukrainian |
| Minimum | $7,946 | $11,586 |
| Maximum | $59,700 | $95,117 |
| Range | $51,754 | $83,531 |
| Mean | $26,182 | $42,023 |
| Median | $27,256 | $39,896 |
| Interquartile 25% (IQ1) | $18,286 | $32,403 |
| Interquartile 75% (IQ3) | $30,810 | $51,527 |
| Interquartile Range (IQR) | $12,524 | $19,124 |
| Standard Deviation (Sample) | $9,146 | $15,846 |
| Standard Deviation (Population) | $9,059 | $15,703 |
Similar Demographics by Per Capita Income
Demographics Similar to Blackfeet by Per Capita Income
In terms of per capita income, the demographic groups most similar to Blackfeet are Dominican ($37,697, a difference of 0.0%), Central American Indian ($37,699, a difference of 0.010%), Guatemalan ($37,766, a difference of 0.19%), African ($37,785, a difference of 0.24%), and U.S. Virgin Islander ($37,589, a difference of 0.28%).
| Demographics | Rating | Rank | Per Capita Income |
| Immigrants | Dominica | 0.2 /100 | #281 | Tragic $37,952 |
| Immigrants | Laos | 0.1 /100 | #282 | Tragic $37,857 |
| Pennsylvania Germans | 0.1 /100 | #283 | Tragic $37,842 |
| Africans | 0.1 /100 | #284 | Tragic $37,785 |
| Guatemalans | 0.1 /100 | #285 | Tragic $37,766 |
| Central American Indians | 0.1 /100 | #286 | Tragic $37,699 |
| Dominicans | 0.1 /100 | #287 | Tragic $37,697 |
| Blackfeet | 0.1 /100 | #288 | Tragic $37,695 |
| U.S. Virgin Islanders | 0.1 /100 | #289 | Tragic $37,589 |
| Immigrants | Guatemala | 0.1 /100 | #290 | Tragic $37,550 |
| Cajuns | 0.1 /100 | #291 | Tragic $37,527 |
| Immigrants | Micronesia | 0.1 /100 | #292 | Tragic $37,464 |
| Mexican American Indians | 0.1 /100 | #293 | Tragic $37,407 |
| Cubans | 0.1 /100 | #294 | Tragic $37,383 |
| Immigrants | Dominican Republic | 0.1 /100 | #295 | Tragic $37,306 |
Demographics Similar to Ukrainians by Per Capita Income
In terms of per capita income, the demographic groups most similar to Ukrainians are Immigrants from Southern Europe ($48,027, a difference of 0.030%), Austrian ($48,116, a difference of 0.21%), Immigrants from Ukraine ($48,134, a difference of 0.25%), Immigrants from Brazil ($48,164, a difference of 0.31%), and Immigrants from Indonesia ($48,195, a difference of 0.38%).
| Demographics | Rating | Rank | Per Capita Income |
| Egyptians | 99.5 /100 | #80 | Exceptional $48,358 |
| Armenians | 99.4 /100 | #81 | Exceptional $48,287 |
| Immigrants | Indonesia | 99.4 /100 | #82 | Exceptional $48,195 |
| Immigrants | Brazil | 99.4 /100 | #83 | Exceptional $48,164 |
| Immigrants | Ukraine | 99.3 /100 | #84 | Exceptional $48,134 |
| Austrians | 99.3 /100 | #85 | Exceptional $48,116 |
| Immigrants | Southern Europe | 99.3 /100 | #86 | Exceptional $48,027 |
| Ukrainians | 99.3 /100 | #87 | Exceptional $48,014 |
| Croatians | 99.0 /100 | #88 | Exceptional $47,742 |
| Northern Europeans | 98.9 /100 | #89 | Exceptional $47,698 |
| Italians | 98.8 /100 | #90 | Exceptional $47,574 |
| Macedonians | 98.8 /100 | #91 | Exceptional $47,573 |
| Immigrants | Moldova | 98.7 /100 | #92 | Exceptional $47,489 |
| Immigrants | Zimbabwe | 98.5 /100 | #93 | Exceptional $47,394 |
| Albanians | 98.5 /100 | #94 | Exceptional $47,379 |