Egyptian vs Bolivian Per Capita Income
COMPARE
Egyptian
Bolivian
Per Capita Income
Per Capita Income Comparison
Egyptians
Bolivians
$48,358
PER CAPITA INCOME
99.5/ 100
METRIC RATING
80th/ 347
METRIC RANK
$49,526
PER CAPITA INCOME
99.9/ 100
METRIC RATING
65th/ 347
METRIC RANK
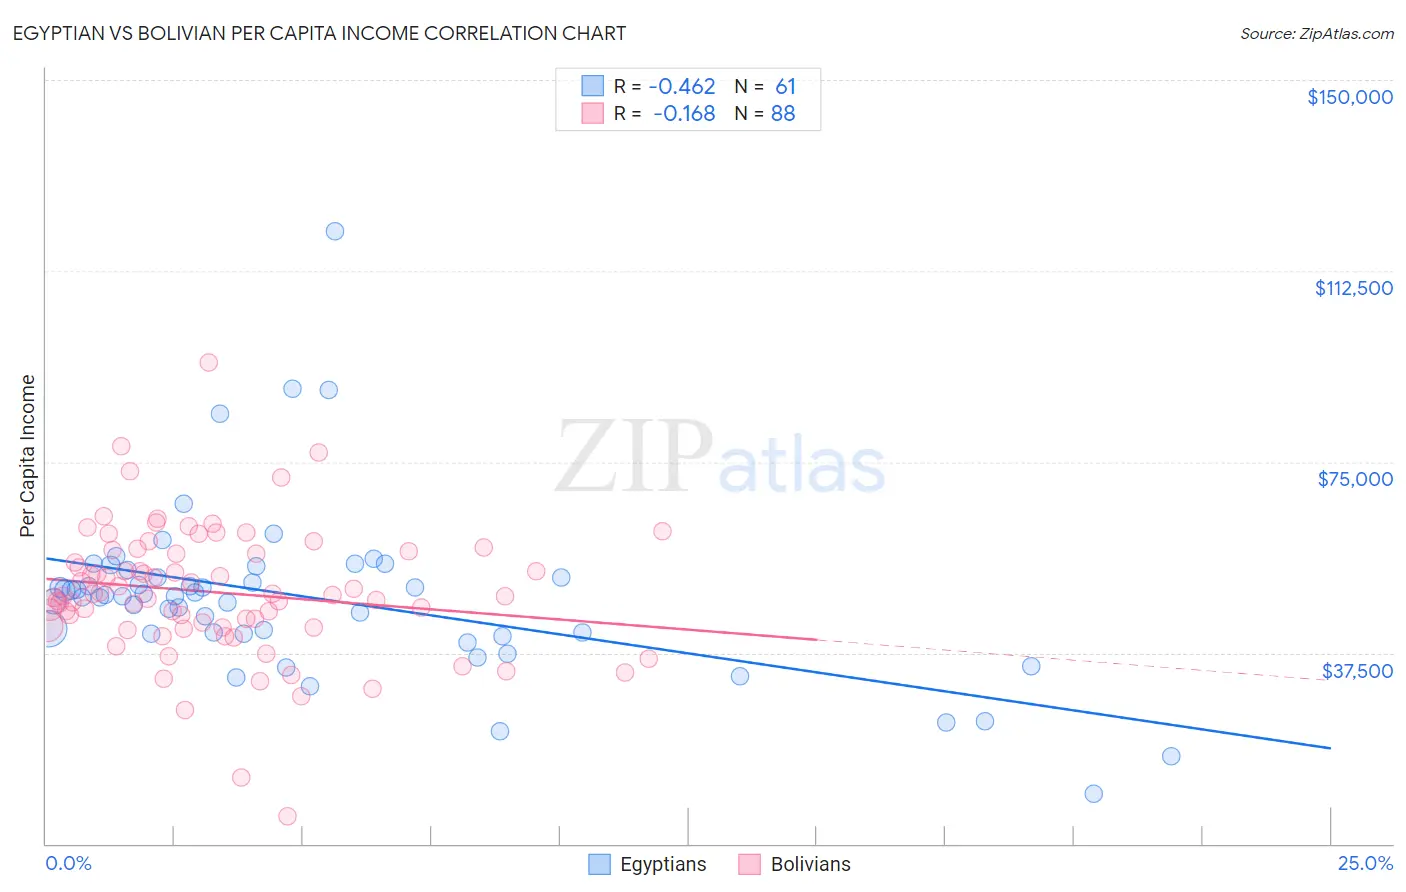
Egyptian vs Bolivian Per Capita Income Correlation Chart
The statistical analysis conducted on geographies consisting of 276,936,692 people shows a moderate negative correlation between the proportion of Egyptians and per capita income in the United States with a correlation coefficient (R) of -0.462 and weighted average of $48,358. Similarly, the statistical analysis conducted on geographies consisting of 184,684,256 people shows a poor negative correlation between the proportion of Bolivians and per capita income in the United States with a correlation coefficient (R) of -0.168 and weighted average of $49,526, a difference of 2.4%.
Per Capita Income Correlation Summary
| Measurement | Egyptian | Bolivian |
| Minimum | $9,805 | $5,324 |
| Maximum | $120,225 | $94,448 |
| Range | $110,420 | $89,124 |
| Mean | $48,391 | $49,375 |
| Median | $48,690 | $48,769 |
| Interquartile 25% (IQ1) | $41,170 | $42,691 |
| Interquartile 75% (IQ3) | $53,076 | $57,269 |
| Interquartile Range (IQR) | $11,906 | $14,578 |
| Standard Deviation (Sample) | $16,881 | $13,010 |
| Standard Deviation (Population) | $16,742 | $12,935 |
Demographics Similar to Egyptians and Bolivians by Per Capita Income
In terms of per capita income, the demographic groups most similar to Egyptians are Armenian ($48,287, a difference of 0.15%), Romanian ($48,445, a difference of 0.18%), Immigrants from Indonesia ($48,195, a difference of 0.34%), Immigrants from Italy ($48,654, a difference of 0.61%), and Immigrants from Kazakhstan ($48,747, a difference of 0.80%). Similarly, the demographic groups most similar to Bolivians are Immigrants from Bulgaria ($49,482, a difference of 0.090%), Immigrants from Romania ($49,463, a difference of 0.13%), Lithuanian ($49,448, a difference of 0.16%), Immigrants from Argentina ($49,627, a difference of 0.20%), and Maltese ($49,640, a difference of 0.23%).
| Demographics | Rating | Rank | Per Capita Income |
| Immigrants | Asia | 99.9 /100 | #62 | Exceptional $49,741 |
| Maltese | 99.9 /100 | #63 | Exceptional $49,640 |
| Immigrants | Argentina | 99.9 /100 | #64 | Exceptional $49,627 |
| Bolivians | 99.9 /100 | #65 | Exceptional $49,526 |
| Immigrants | Bulgaria | 99.9 /100 | #66 | Exceptional $49,482 |
| Immigrants | Romania | 99.9 /100 | #67 | Exceptional $49,463 |
| Lithuanians | 99.8 /100 | #68 | Exceptional $49,448 |
| Immigrants | Canada | 99.8 /100 | #69 | Exceptional $49,412 |
| Immigrants | Eastern Europe | 99.8 /100 | #70 | Exceptional $49,316 |
| Greeks | 99.8 /100 | #71 | Exceptional $49,309 |
| Immigrants | Hungary | 99.8 /100 | #72 | Exceptional $49,303 |
| Immigrants | North America | 99.8 /100 | #73 | Exceptional $49,302 |
| Mongolians | 99.8 /100 | #74 | Exceptional $49,173 |
| Immigrants | Bolivia | 99.7 /100 | #75 | Exceptional $48,970 |
| Immigrants | England | 99.7 /100 | #76 | Exceptional $48,844 |
| Immigrants | Kazakhstan | 99.7 /100 | #77 | Exceptional $48,747 |
| Immigrants | Italy | 99.6 /100 | #78 | Exceptional $48,654 |
| Romanians | 99.5 /100 | #79 | Exceptional $48,445 |
| Egyptians | 99.5 /100 | #80 | Exceptional $48,358 |
| Armenians | 99.4 /100 | #81 | Exceptional $48,287 |
| Immigrants | Indonesia | 99.4 /100 | #82 | Exceptional $48,195 |