Blackfeet vs Immigrants from Jordan Per Capita Income

COMPARE

Blackfeet
Race
Ancestry
AfghanAfricanAlaska NativeAlaskan AthabascanAlbanianAleutAlsatianAmericanApacheArabArapahoArgentineanArmenianAssyrian/Chaldean/SyriacAustralianAustrianBahamianBangladeshiBarbadianBasqueBelgianBelizeanBermudanBhutaneseBlackfeetBolivianBrazilianBritishBritish West IndianBulgarianBurmeseCajunCambodianCanadianCape VerdeanCarpatho RusynCelticCentral AmericanCentral American IndianCherokeeCheyenneChickasawChileanChineseChippewaChoctawColombianColvilleComancheCosta RicanCreeCreekCroatianCrowCubanCypriotCzechCzechoslovakianDanishDelawareDominicanDutchDutch West IndianEastern EuropeanEcuadorianEgyptianEnglishEstonianEthiopianEuropeanFijianFilipinoFinnishFrenchFrench American IndianFrench CanadianGermanGerman RussianGhanaianGreekGuamanian/ChamorroGuatemalanGuyaneseHaitianHmongHonduranHopiHoumaHungarianIcelanderIndian (Asian)IndonesianInupiatIranianIraqiIrishIroquoisIsraeliItalianJamaicanJapaneseJordanianKenyanKiowaKoreanLaotianLatvianLebaneseLiberianLithuanianLumbeeLuxembourgerMacedonianMalaysianMalteseMarshalleseMenomineeMexicanMexican American IndianMongolianMoroccanNative HawaiianNavajoNepaleseNew ZealanderNicaraguanNigerianNorthern EuropeanNorwegianOkinawanOsageOttawaPaiutePakistaniPalestinianPanamanianParaguayanPennsylvania GermanPeruvianPimaPolishPortuguesePotawatomiPuebloPuerto RicanPuget Sound SalishRomanianRussianSalvadoranSamoanScandinavianScotch-IrishScottishSeminoleSenegaleseSerbianShoshoneSierra LeoneanSiouxSlavicSlovakSloveneSomaliSouth AfricanSouth AmericanSouth American IndianSoviet UnionSpaniardSpanishSpanish AmericanSpanish American IndianSri LankanSubsaharan AfricanSudaneseSwedishSwissSyrianTaiwaneseThaiTlingit-HaidaTohono O'OdhamTonganTrinidadian and TobagonianTsimshianTurkishU.S. Virgin IslanderUgandanUkrainianUruguayanUteVenezuelanVietnameseWelshWest IndianYakamaYaquiYugoslavianYumanYup'ikZimbabwean
Immigration
NonimmigrantsImmigrantsAfghanistanAfricaAlbaniaArgentinaArmeniaAsiaAustraliaAustriaBahamasBangladeshBarbadosBelarusBelgiumBelizeBoliviaBosnia and HerzegovinaBrazilBulgariaBurma/MyanmarCabo VerdeCambodiaCameroonCanadaCaribbeanCentral AmericaChileChinaColombiaCongoCosta RicaCroatiaCubaCzechoslovakiaDenmarkDominicaDominican RepublicEastern AfricaEastern AsiaEastern EuropeEcuadorEgyptEl SalvadorEnglandEritreaEthiopiaEuropeFijiFranceGermanyGhanaGreeceGrenadaGuatemalaGuyanaHaitiHondurasHong KongHungaryIndiaIndonesiaIranIraqIrelandIsraelItalyJamaicaJapanKazakhstanKenyaKoreaKuwaitLaosLatin AmericaLatviaLebanonLiberiaLithuaniaMalaysiaMexicoMicronesiaMiddle AfricaMoldovaMoroccoNepalNetherlandsNicaraguaNigeriaNorth AmericaNorth MacedoniaNorthern AfricaNorthern EuropeNorwayOceaniaPakistanPanamaPeruPhilippinesPolandPortugalRomaniaRussiaSaudi ArabiaScotlandSenegalSerbiaSierra LeoneSingaporeSomaliaSouth AfricaSouth AmericaSouth Central AsiaSouth Eastern AsiaSouthern EuropeSpainSri LankaSt. Vincent and the GrenadinesSudanSwedenSwitzerlandSyriaTaiwanThailandTrinidad and TobagoTurkeyUgandaUkraineUruguayUzbekistanVenezuelaVietnamWest IndiesWestern AfricaWestern AsiaWestern EuropeYemenZaireZimbabweAzores
Immigrants from Jordan
Race
Ancestry
AfghanAfricanAlaska NativeAlaskan AthabascanAlbanianAleutAlsatianAmericanApacheArabArapahoArgentineanArmenianAssyrian/Chaldean/SyriacAustralianAustrianBahamianBangladeshiBarbadianBasqueBelgianBelizeanBermudanBhutaneseBolivianBrazilianBritishBritish West IndianBulgarianBurmeseCajunCambodianCanadianCape VerdeanCarpatho RusynCelticCentral AmericanCentral American IndianCherokeeCheyenneChickasawChileanChineseChippewaChoctawColombianColvilleComancheCosta RicanCreeCreekCroatianCrowCubanCypriotCzechCzechoslovakianDanishDelawareDominicanDutchDutch West IndianEastern EuropeanEcuadorianEgyptianEnglishEstonianEthiopianEuropeanFijianFilipinoFinnishFrenchFrench American IndianFrench CanadianGermanGerman RussianGhanaianGreekGuamanian/ChamorroGuatemalanGuyaneseHaitianHmongHonduranHopiHoumaHungarianIcelanderIndian (Asian)IndonesianInupiatIranianIraqiIrishIroquoisIsraeliItalianJamaicanJapaneseJordanianKenyanKiowaKoreanLaotianLatvianLebaneseLiberianLithuanianLumbeeLuxembourgerMacedonianMalaysianMalteseMarshalleseMenomineeMexicanMexican American IndianMongolianMoroccanNative HawaiianNavajoNepaleseNew ZealanderNicaraguanNigerianNorthern EuropeanNorwegianOkinawanOsageOttawaPaiutePakistaniPalestinianPanamanianParaguayanPennsylvania GermanPeruvianPimaPolishPortuguesePotawatomiPuebloPuerto RicanPuget Sound SalishRomanianRussianSalvadoranSamoanScandinavianScotch-IrishScottishSeminoleSenegaleseSerbianShoshoneSierra LeoneanSiouxSlavicSlovakSloveneSomaliSouth AfricanSouth AmericanSouth American IndianSoviet UnionSpaniardSpanishSpanish AmericanSpanish American IndianSri LankanSubsaharan AfricanSudaneseSwedishSwissSyrianTaiwaneseThaiTlingit-HaidaTohono O'OdhamTonganTrinidadian and TobagonianTsimshianTurkishU.S. Virgin IslanderUgandanUkrainianUruguayanUteVenezuelanVietnameseWelshWest IndianYakamaYaquiYugoslavianYumanYup'ikZimbabwean
Immigration
NonimmigrantsImmigrantsAfghanistanAfricaAlbaniaArgentinaArmeniaAsiaAustraliaAustriaBahamasBangladeshBarbadosBelarusBelgiumBelizeBoliviaBosnia and HerzegovinaBrazilBulgariaBurma/MyanmarCabo VerdeCambodiaCameroonCanadaCaribbeanCentral AmericaChileChinaColombiaCongoCosta RicaCroatiaCubaCzechoslovakiaDenmarkDominicaDominican RepublicEastern AfricaEastern AsiaEastern EuropeEcuadorEgyptEl SalvadorEnglandEritreaEthiopiaEuropeFijiFranceGermanyGhanaGreeceGrenadaGuatemalaGuyanaHaitiHondurasHong KongHungaryIndiaIndonesiaIranIraqIrelandIsraelItalyJamaicaJapanJordanKazakhstanKenyaKoreaKuwaitLaosLatin AmericaLatviaLebanonLiberiaLithuaniaMalaysiaMexicoMicronesiaMiddle AfricaMoldovaMoroccoNepalNetherlandsNicaraguaNigeriaNorth AmericaNorth MacedoniaNorthern AfricaNorthern EuropeNorwayOceaniaPakistanPanamaPeruPhilippinesPolandPortugalRomaniaRussiaSaudi ArabiaScotlandSenegalSerbiaSierra LeoneSingaporeSomaliaSouth AfricaSouth AmericaSouth Central AsiaSouth Eastern AsiaSouthern EuropeSpainSri LankaSt. Vincent and the GrenadinesSudanSwedenSwitzerlandSyriaTaiwanThailandTrinidad and TobagoTurkeyUgandaUkraineUruguayUzbekistanVenezuelaVietnamWest IndiesWestern AfricaWestern AsiaWestern EuropeYemenZaireZimbabweAzores
Per Capita Income
Income
Poverty
Unemployment
Labor Participation
Family Structure
Vehicle Availability
Education Level
Disability

Per Capita Income Comparison

Blackfeet

Immigrants from Jordan

Tragic
Excellent
$37,695
PER CAPITA INCOME
0.1/ 100
METRIC RATING
288th/ 347
METRIC RANK
$45,066
PER CAPITA INCOME
82.9/ 100
METRIC RATING
140th/ 347
METRIC RANK

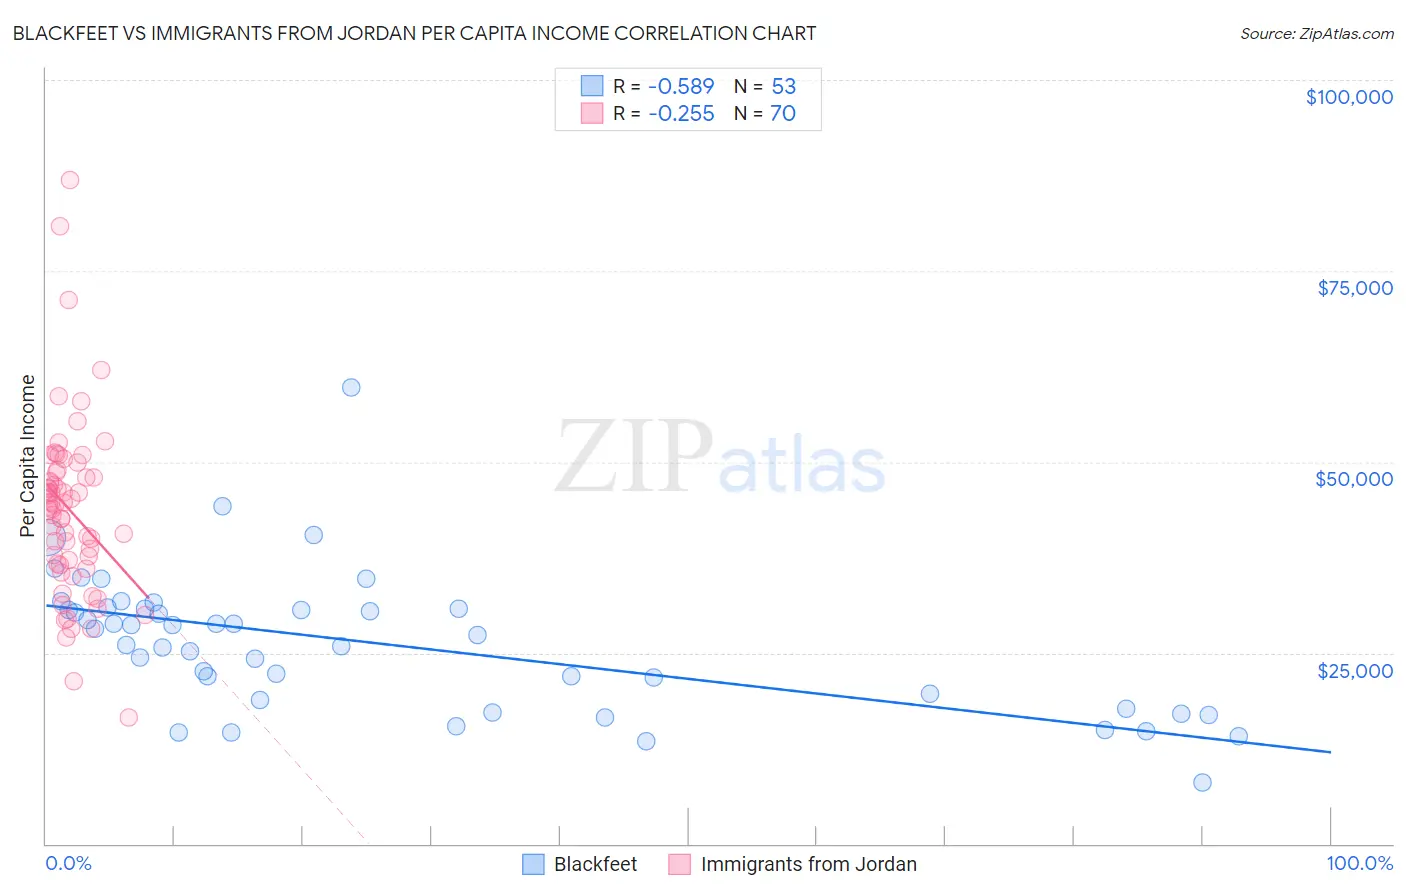
Blackfeet vs Immigrants from Jordan Per Capita Income Correlation Chart

The statistical analysis conducted on geographies consisting of 309,586,612 people shows a substantial negative correlation between the proportion of Blackfeet and per capita income in the United States with a correlation coefficient (R) of -0.589 and weighted average of $37,695. Similarly, the statistical analysis conducted on geographies consisting of 181,275,408 people shows a weak negative correlation between the proportion of Immigrants from Jordan and per capita income in the United States with a correlation coefficient (R) of -0.255 and weighted average of $45,066, a difference of 19.6%.
Blackfeet vs Immigrants from Jordan Per Capita Income

Per Capita Income Correlation Summary

MeasurementBlackfeetImmigrants from Jordan
Minimum$7,946$16,508
Maximum$59,700$86,887
Range$51,754$70,379
Mean$26,182$43,703
Median$27,256$44,361
Interquartile 25% (IQ1)$18,286$36,695
Interquartile 75% (IQ3)$30,810$48,682
Interquartile Range (IQR)$12,524$11,987
Standard Deviation (Sample)$9,146$11,687
Standard Deviation (Population)$9,059$11,603

Similar Demographics by Per Capita Income

Demographics Similar to Blackfeet by Per Capita Income

In terms of per capita income, the demographic groups most similar to Blackfeet are Dominican ($37,697, a difference of 0.0%), Central American Indian ($37,699, a difference of 0.010%), Guatemalan ($37,766, a difference of 0.19%), African ($37,785, a difference of 0.24%), and U.S. Virgin Islander ($37,589, a difference of 0.28%).
DemographicsRating | RankPer Capita Income
Immigrants | Dominica
0.2
/100
|
#281
Tragic
$37,952
Immigrants | Laos
0.1
/100
|
#282
Tragic
$37,857
Pennsylvania Germans
0.1
/100
|
#283
Tragic
$37,842
Africans
0.1
/100
|
#284
Tragic
$37,785
Guatemalans
0.1
/100
|
#285
Tragic
$37,766
Central American Indians
0.1
/100
|
#286
Tragic
$37,699
Dominicans
0.1
/100
|
#287
Tragic
$37,697
Blackfeet
0.1
/100
|
#288
Tragic
$37,695
U.S. Virgin Islanders
0.1
/100
|
#289
Tragic
$37,589
Immigrants | Guatemala
0.1
/100
|
#290
Tragic
$37,550
Cajuns
0.1
/100
|
#291
Tragic
$37,527
Immigrants | Micronesia
0.1
/100
|
#292
Tragic
$37,464
Mexican American Indians
0.1
/100
|
#293
Tragic
$37,407
Cubans
0.1
/100
|
#294
Tragic
$37,383
Immigrants | Dominican Republic
0.1
/100
|
#295
Tragic
$37,306

Demographics Similar to Immigrants from Jordan by Per Capita Income

In terms of per capita income, the demographic groups most similar to Immigrants from Jordan are Slavic ($45,049, a difference of 0.040%), Ugandan ($45,047, a difference of 0.040%), Basque ($45,086, a difference of 0.050%), Immigrants from Uganda ($45,043, a difference of 0.050%), and Icelander ($44,987, a difference of 0.18%).
DemographicsRating | RankPer Capita Income
Pakistanis
89.7
/100
|
#133
Excellent
$45,587
Slovenes
89.6
/100
|
#134
Excellent
$45,581
Hungarians
87.9
/100
|
#135
Excellent
$45,426
Immigrants | Oceania
85.2
/100
|
#136
Excellent
$45,220
Immigrants | Syria
85.2
/100
|
#137
Excellent
$45,218
Assyrians/Chaldeans/Syriacs
84.8
/100
|
#138
Excellent
$45,195
Basques
83.2
/100
|
#139
Excellent
$45,086
Immigrants | Jordan
82.9
/100
|
#140
Excellent
$45,066
Slavs
82.6
/100
|
#141
Excellent
$45,049
Ugandans
82.6
/100
|
#142
Excellent
$45,047
Immigrants | Uganda
82.5
/100
|
#143
Excellent
$45,043
Icelanders
81.6
/100
|
#144
Excellent
$44,987
Immigrants | Afghanistan
78.0
/100
|
#145
Good
$44,790
Irish
75.8
/100
|
#146
Good
$44,679
Czechs
74.1
/100
|
#147
Good
$44,595