Blackfeet vs Bolivian Divorced or Separated
COMPARE
Blackfeet
Bolivian
Divorced or Separated
Divorced or Separated Comparison
Blackfeet
Bolivians
13.3%
DIVORCED OR SEPARATED
0.0/ 100
METRIC RATING
312th/ 347
METRIC RANK
11.2%
DIVORCED OR SEPARATED
100.0/ 100
METRIC RATING
50th/ 347
METRIC RANK
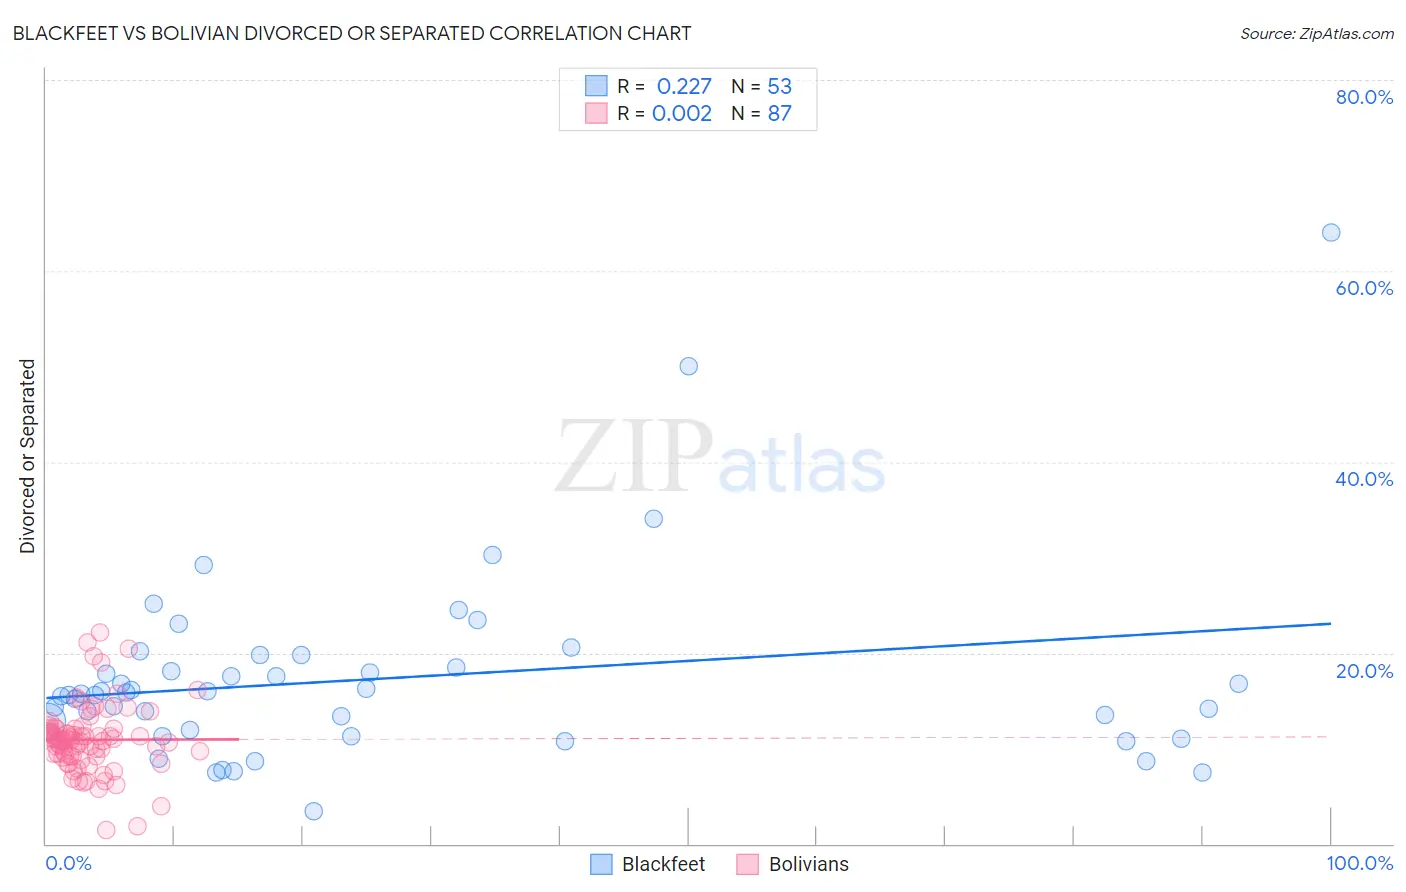
Blackfeet vs Bolivian Divorced or Separated Correlation Chart
The statistical analysis conducted on geographies consisting of 309,547,647 people shows a weak positive correlation between the proportion of Blackfeet and percentage of population currently divorced or separated in the United States with a correlation coefficient (R) of 0.227 and weighted average of 13.3%. Similarly, the statistical analysis conducted on geographies consisting of 184,650,431 people shows no correlation between the proportion of Bolivians and percentage of population currently divorced or separated in the United States with a correlation coefficient (R) of 0.002 and weighted average of 11.2%, a difference of 18.4%.
Divorced or Separated Correlation Summary
| Measurement | Blackfeet | Bolivian |
| Minimum | 3.4% | 1.5% |
| Maximum | 64.0% | 22.1% |
| Range | 60.6% | 20.6% |
| Mean | 17.3% | 10.9% |
| Median | 15.7% | 10.8% |
| Interquartile 25% (IQ1) | 11.6% | 9.2% |
| Interquartile 75% (IQ3) | 19.1% | 12.1% |
| Interquartile Range (IQR) | 7.6% | 2.9% |
| Standard Deviation (Sample) | 10.0% | 3.6% |
| Standard Deviation (Population) | 9.9% | 3.5% |
Similar Demographics by Divorced or Separated
Demographics Similar to Blackfeet by Divorced or Separated
In terms of divorced or separated, the demographic groups most similar to Blackfeet are Immigrants from Nicaragua (13.3%, a difference of 0.19%), Yaqui (13.3%, a difference of 0.21%), Sioux (13.2%, a difference of 0.35%), African (13.2%, a difference of 0.37%), and American (13.2%, a difference of 0.39%).
| Demographics | Rating | Rank | Divorced or Separated |
| Chippewa | 0.0 /100 | #305 | Tragic 13.2% |
| Tlingit-Haida | 0.0 /100 | #306 | Tragic 13.2% |
| French American Indians | 0.0 /100 | #307 | Tragic 13.2% |
| Ottawa | 0.0 /100 | #308 | Tragic 13.2% |
| Americans | 0.0 /100 | #309 | Tragic 13.2% |
| Africans | 0.0 /100 | #310 | Tragic 13.2% |
| Sioux | 0.0 /100 | #311 | Tragic 13.2% |
| Blackfeet | 0.0 /100 | #312 | Tragic 13.3% |
| Immigrants | Nicaragua | 0.0 /100 | #313 | Tragic 13.3% |
| Yaqui | 0.0 /100 | #314 | Tragic 13.3% |
| Spanish Americans | 0.0 /100 | #315 | Tragic 13.3% |
| Tsimshian | 0.0 /100 | #316 | Tragic 13.3% |
| Haitians | 0.0 /100 | #317 | Tragic 13.3% |
| Cree | 0.0 /100 | #318 | Tragic 13.4% |
| Puget Sound Salish | 0.0 /100 | #319 | Tragic 13.4% |
Demographics Similar to Bolivians by Divorced or Separated
In terms of divorced or separated, the demographic groups most similar to Bolivians are Immigrants from Saudi Arabia (11.2%, a difference of 0.070%), Immigrants from Turkey (11.2%, a difference of 0.080%), Immigrants from Poland (11.2%, a difference of 0.10%), Laotian (11.2%, a difference of 0.12%), and Turkish (11.2%, a difference of 0.23%).
| Demographics | Rating | Rank | Divorced or Separated |
| Immigrants | Belarus | 100.0 /100 | #43 | Exceptional 11.2% |
| Immigrants | Western Asia | 100.0 /100 | #44 | Exceptional 11.2% |
| Turks | 100.0 /100 | #45 | Exceptional 11.2% |
| Laotians | 100.0 /100 | #46 | Exceptional 11.2% |
| Immigrants | Poland | 100.0 /100 | #47 | Exceptional 11.2% |
| Immigrants | Turkey | 100.0 /100 | #48 | Exceptional 11.2% |
| Immigrants | Saudi Arabia | 100.0 /100 | #49 | Exceptional 11.2% |
| Bolivians | 100.0 /100 | #50 | Exceptional 11.2% |
| Immigrants | Bolivia | 100.0 /100 | #51 | Exceptional 11.3% |
| Immigrants | Australia | 99.9 /100 | #52 | Exceptional 11.3% |
| Immigrants | Lithuania | 99.9 /100 | #53 | Exceptional 11.3% |
| Eastern Europeans | 99.9 /100 | #54 | Exceptional 11.3% |
| Immigrants | Yemen | 99.9 /100 | #55 | Exceptional 11.3% |
| Immigrants | Philippines | 99.9 /100 | #56 | Exceptional 11.3% |
| Immigrants | Vietnam | 99.9 /100 | #57 | Exceptional 11.3% |