Blackfeet vs Immigrants from Moldova Per Capita Income
COMPARE
Blackfeet
Immigrants from Moldova
Per Capita Income
Per Capita Income Comparison
Blackfeet
Immigrants from Moldova
$37,695
PER CAPITA INCOME
0.1/ 100
METRIC RATING
288th/ 347
METRIC RANK
$47,489
PER CAPITA INCOME
98.7/ 100
METRIC RATING
92nd/ 347
METRIC RANK
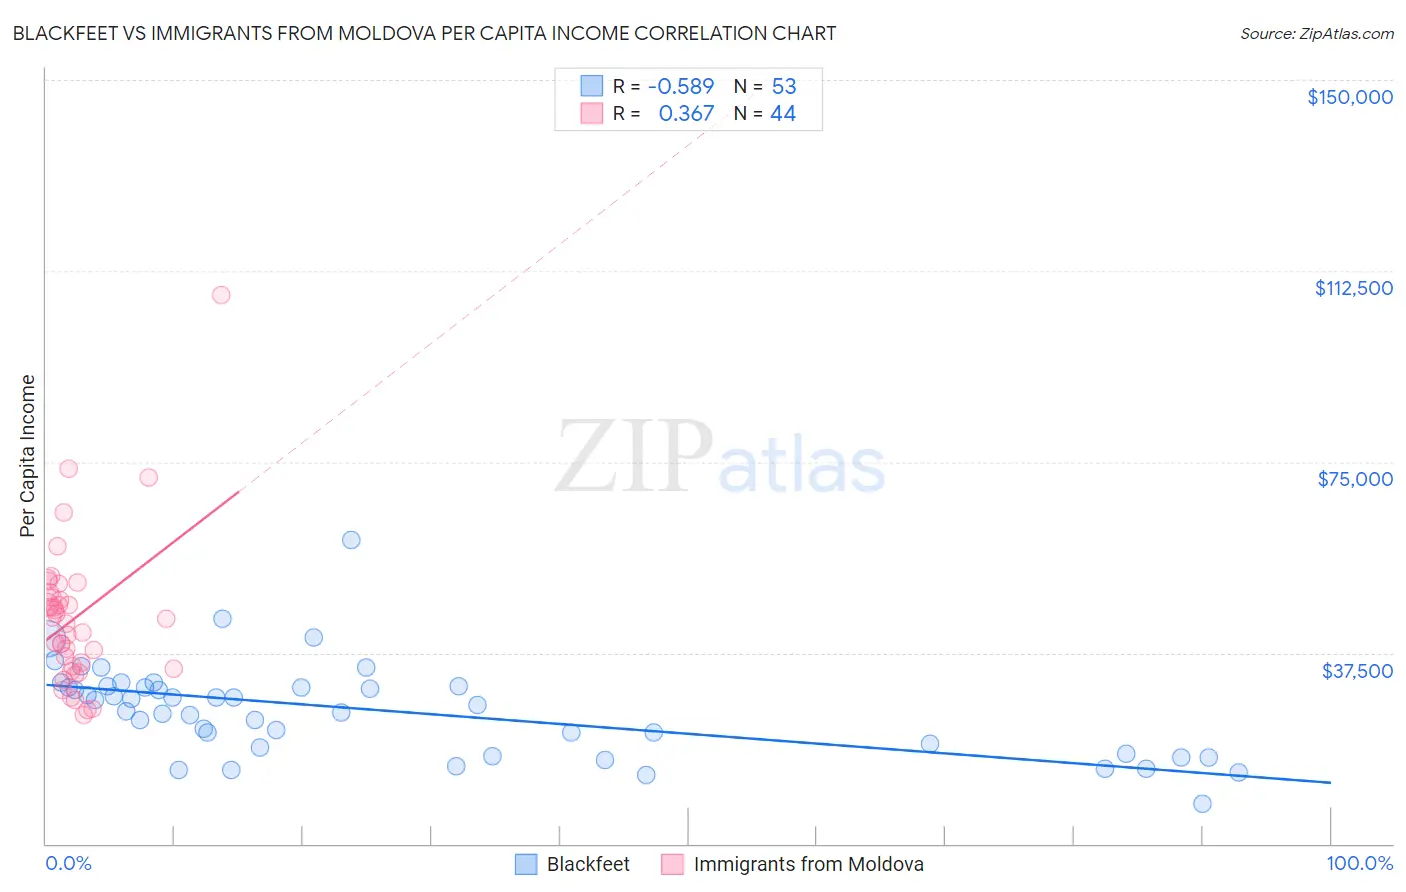
Blackfeet vs Immigrants from Moldova Per Capita Income Correlation Chart
The statistical analysis conducted on geographies consisting of 309,586,612 people shows a substantial negative correlation between the proportion of Blackfeet and per capita income in the United States with a correlation coefficient (R) of -0.589 and weighted average of $37,695. Similarly, the statistical analysis conducted on geographies consisting of 124,402,409 people shows a mild positive correlation between the proportion of Immigrants from Moldova and per capita income in the United States with a correlation coefficient (R) of 0.367 and weighted average of $47,489, a difference of 26.0%.
Per Capita Income Correlation Summary
| Measurement | Blackfeet | Immigrants from Moldova |
| Minimum | $7,946 | $25,195 |
| Maximum | $59,700 | $107,889 |
| Range | $51,754 | $82,694 |
| Mean | $26,182 | $44,404 |
| Median | $27,256 | $43,721 |
| Interquartile 25% (IQ1) | $18,286 | $34,656 |
| Interquartile 75% (IQ3) | $30,810 | $48,923 |
| Interquartile Range (IQR) | $12,524 | $14,267 |
| Standard Deviation (Sample) | $9,146 | $14,744 |
| Standard Deviation (Population) | $9,059 | $14,575 |
Similar Demographics by Per Capita Income
Demographics Similar to Blackfeet by Per Capita Income
In terms of per capita income, the demographic groups most similar to Blackfeet are Dominican ($37,697, a difference of 0.0%), Central American Indian ($37,699, a difference of 0.010%), Guatemalan ($37,766, a difference of 0.19%), African ($37,785, a difference of 0.24%), and U.S. Virgin Islander ($37,589, a difference of 0.28%).
| Demographics | Rating | Rank | Per Capita Income |
| Immigrants | Dominica | 0.2 /100 | #281 | Tragic $37,952 |
| Immigrants | Laos | 0.1 /100 | #282 | Tragic $37,857 |
| Pennsylvania Germans | 0.1 /100 | #283 | Tragic $37,842 |
| Africans | 0.1 /100 | #284 | Tragic $37,785 |
| Guatemalans | 0.1 /100 | #285 | Tragic $37,766 |
| Central American Indians | 0.1 /100 | #286 | Tragic $37,699 |
| Dominicans | 0.1 /100 | #287 | Tragic $37,697 |
| Blackfeet | 0.1 /100 | #288 | Tragic $37,695 |
| U.S. Virgin Islanders | 0.1 /100 | #289 | Tragic $37,589 |
| Immigrants | Guatemala | 0.1 /100 | #290 | Tragic $37,550 |
| Cajuns | 0.1 /100 | #291 | Tragic $37,527 |
| Immigrants | Micronesia | 0.1 /100 | #292 | Tragic $37,464 |
| Mexican American Indians | 0.1 /100 | #293 | Tragic $37,407 |
| Cubans | 0.1 /100 | #294 | Tragic $37,383 |
| Immigrants | Dominican Republic | 0.1 /100 | #295 | Tragic $37,306 |
Demographics Similar to Immigrants from Moldova by Per Capita Income
In terms of per capita income, the demographic groups most similar to Immigrants from Moldova are Italian ($47,574, a difference of 0.18%), Macedonian ($47,573, a difference of 0.18%), Immigrants from Zimbabwe ($47,394, a difference of 0.20%), Albanian ($47,379, a difference of 0.23%), and Immigrants from Egypt ($47,361, a difference of 0.27%).
| Demographics | Rating | Rank | Per Capita Income |
| Austrians | 99.3 /100 | #85 | Exceptional $48,116 |
| Immigrants | Southern Europe | 99.3 /100 | #86 | Exceptional $48,027 |
| Ukrainians | 99.3 /100 | #87 | Exceptional $48,014 |
| Croatians | 99.0 /100 | #88 | Exceptional $47,742 |
| Northern Europeans | 98.9 /100 | #89 | Exceptional $47,698 |
| Italians | 98.8 /100 | #90 | Exceptional $47,574 |
| Macedonians | 98.8 /100 | #91 | Exceptional $47,573 |
| Immigrants | Moldova | 98.7 /100 | #92 | Exceptional $47,489 |
| Immigrants | Zimbabwe | 98.5 /100 | #93 | Exceptional $47,394 |
| Albanians | 98.5 /100 | #94 | Exceptional $47,379 |
| Immigrants | Egypt | 98.5 /100 | #95 | Exceptional $47,361 |
| Alsatians | 98.3 /100 | #96 | Exceptional $47,284 |
| Carpatho Rusyns | 98.2 /100 | #97 | Exceptional $47,248 |
| Immigrants | Pakistan | 97.9 /100 | #98 | Exceptional $47,084 |
| Laotians | 97.8 /100 | #99 | Exceptional $47,041 |