Immigrants from Iraq vs Bolivian Per Capita Income
COMPARE
Immigrants from Iraq
Bolivian
Per Capita Income
Per Capita Income Comparison
Immigrants from Iraq
Bolivians
$41,365
PER CAPITA INCOME
7.1/ 100
METRIC RATING
222nd/ 347
METRIC RANK
$49,526
PER CAPITA INCOME
99.9/ 100
METRIC RATING
65th/ 347
METRIC RANK
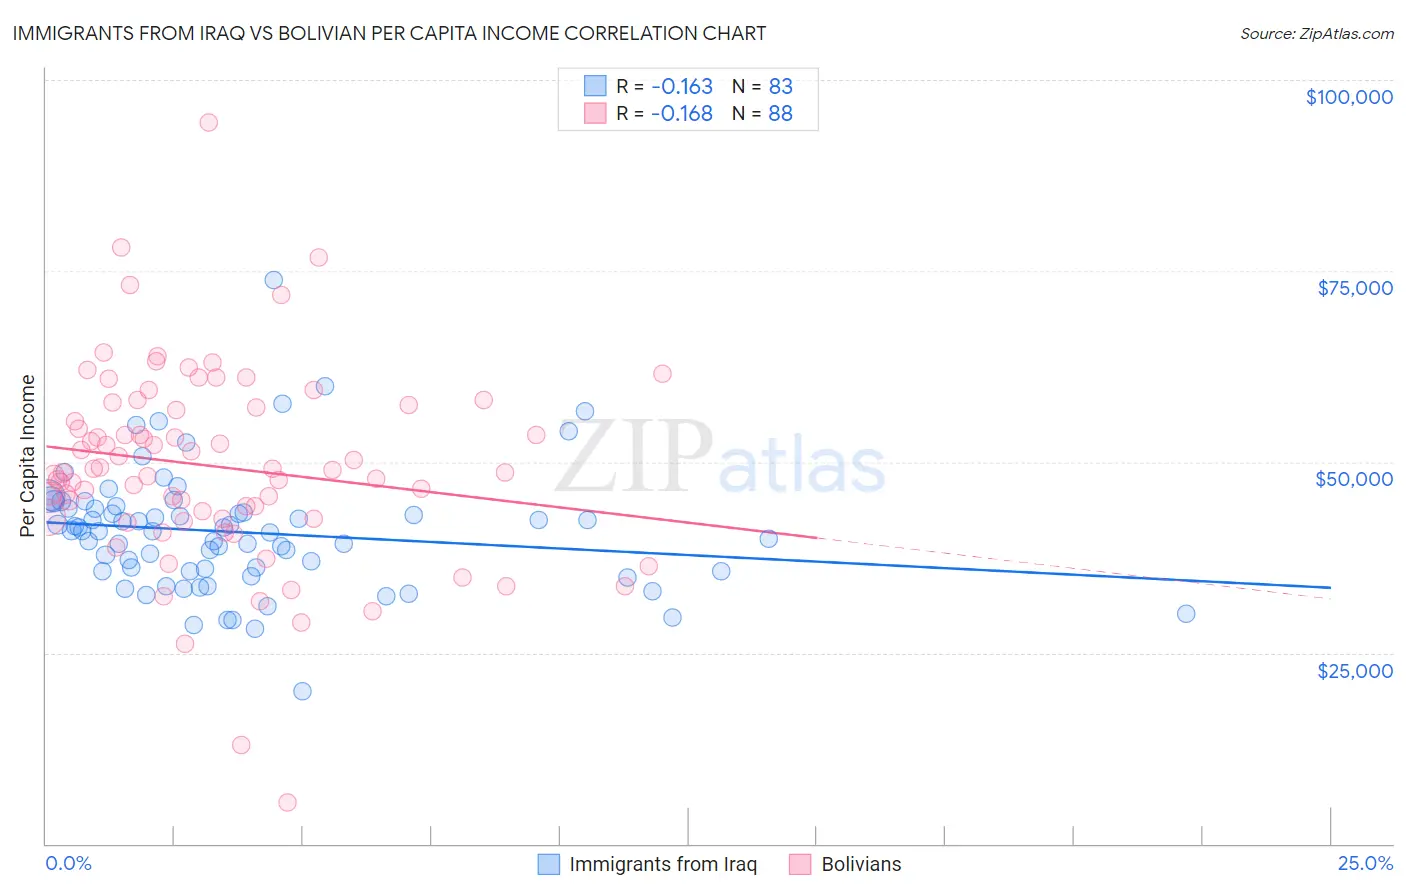
Immigrants from Iraq vs Bolivian Per Capita Income Correlation Chart
The statistical analysis conducted on geographies consisting of 194,781,264 people shows a poor negative correlation between the proportion of Immigrants from Iraq and per capita income in the United States with a correlation coefficient (R) of -0.163 and weighted average of $41,365. Similarly, the statistical analysis conducted on geographies consisting of 184,684,256 people shows a poor negative correlation between the proportion of Bolivians and per capita income in the United States with a correlation coefficient (R) of -0.168 and weighted average of $49,526, a difference of 19.7%.
Per Capita Income Correlation Summary
| Measurement | Immigrants from Iraq | Bolivian |
| Minimum | $19,973 | $5,324 |
| Maximum | $73,810 | $94,448 |
| Range | $53,837 | $89,124 |
| Mean | $40,767 | $49,375 |
| Median | $40,988 | $48,769 |
| Interquartile 25% (IQ1) | $35,615 | $42,691 |
| Interquartile 75% (IQ3) | $43,922 | $57,269 |
| Interquartile Range (IQR) | $8,307 | $14,578 |
| Standard Deviation (Sample) | $8,068 | $13,010 |
| Standard Deviation (Population) | $8,019 | $12,935 |
Similar Demographics by Per Capita Income
Demographics Similar to Immigrants from Iraq by Per Capita Income
In terms of per capita income, the demographic groups most similar to Immigrants from Iraq are Immigrants from Cameroon ($41,334, a difference of 0.070%), Immigrants from St. Vincent and the Grenadines ($41,270, a difference of 0.23%), Immigrants from Barbados ($41,478, a difference of 0.27%), Immigrants from Trinidad and Tobago ($41,476, a difference of 0.27%), and Puget Sound Salish ($41,495, a difference of 0.31%).
| Demographics | Rating | Rank | Per Capita Income |
| Sudanese | 9.9 /100 | #215 | Tragic $41,695 |
| Tongans | 9.9 /100 | #216 | Tragic $41,693 |
| Guamanians/Chamorros | 9.7 /100 | #217 | Tragic $41,678 |
| Trinidadians and Tobagonians | 9.5 /100 | #218 | Tragic $41,655 |
| Puget Sound Salish | 8.1 /100 | #219 | Tragic $41,495 |
| Immigrants | Barbados | 7.9 /100 | #220 | Tragic $41,478 |
| Immigrants | Trinidad and Tobago | 7.9 /100 | #221 | Tragic $41,476 |
| Immigrants | Iraq | 7.1 /100 | #222 | Tragic $41,365 |
| Immigrants | Cameroon | 6.8 /100 | #223 | Tragic $41,334 |
| Immigrants | St. Vincent and the Grenadines | 6.4 /100 | #224 | Tragic $41,270 |
| West Indians | 6.0 /100 | #225 | Tragic $41,217 |
| Immigrants | Ecuador | 5.9 /100 | #226 | Tragic $41,195 |
| Immigrants | Ghana | 5.5 /100 | #227 | Tragic $41,131 |
| Immigrants | Grenada | 5.5 /100 | #228 | Tragic $41,123 |
| Nigerians | 4.9 /100 | #229 | Tragic $41,026 |
Demographics Similar to Bolivians by Per Capita Income
In terms of per capita income, the demographic groups most similar to Bolivians are Immigrants from Bulgaria ($49,482, a difference of 0.090%), Immigrants from Romania ($49,463, a difference of 0.13%), Lithuanian ($49,448, a difference of 0.16%), Immigrants from Argentina ($49,627, a difference of 0.20%), and Maltese ($49,640, a difference of 0.23%).
| Demographics | Rating | Rank | Per Capita Income |
| Immigrants | Malaysia | 99.9 /100 | #58 | Exceptional $49,983 |
| Bhutanese | 99.9 /100 | #59 | Exceptional $49,894 |
| Immigrants | Scotland | 99.9 /100 | #60 | Exceptional $49,893 |
| Argentineans | 99.9 /100 | #61 | Exceptional $49,862 |
| Immigrants | Asia | 99.9 /100 | #62 | Exceptional $49,741 |
| Maltese | 99.9 /100 | #63 | Exceptional $49,640 |
| Immigrants | Argentina | 99.9 /100 | #64 | Exceptional $49,627 |
| Bolivians | 99.9 /100 | #65 | Exceptional $49,526 |
| Immigrants | Bulgaria | 99.9 /100 | #66 | Exceptional $49,482 |
| Immigrants | Romania | 99.9 /100 | #67 | Exceptional $49,463 |
| Lithuanians | 99.8 /100 | #68 | Exceptional $49,448 |
| Immigrants | Canada | 99.8 /100 | #69 | Exceptional $49,412 |
| Immigrants | Eastern Europe | 99.8 /100 | #70 | Exceptional $49,316 |
| Greeks | 99.8 /100 | #71 | Exceptional $49,309 |
| Immigrants | Hungary | 99.8 /100 | #72 | Exceptional $49,303 |