Blackfeet vs French Canadian Per Capita Income
COMPARE
Blackfeet
French Canadian
Per Capita Income
Per Capita Income Comparison
Blackfeet
French Canadians
$37,695
PER CAPITA INCOME
0.1/ 100
METRIC RATING
288th/ 347
METRIC RANK
$43,003
PER CAPITA INCOME
32.3/ 100
METRIC RATING
186th/ 347
METRIC RANK
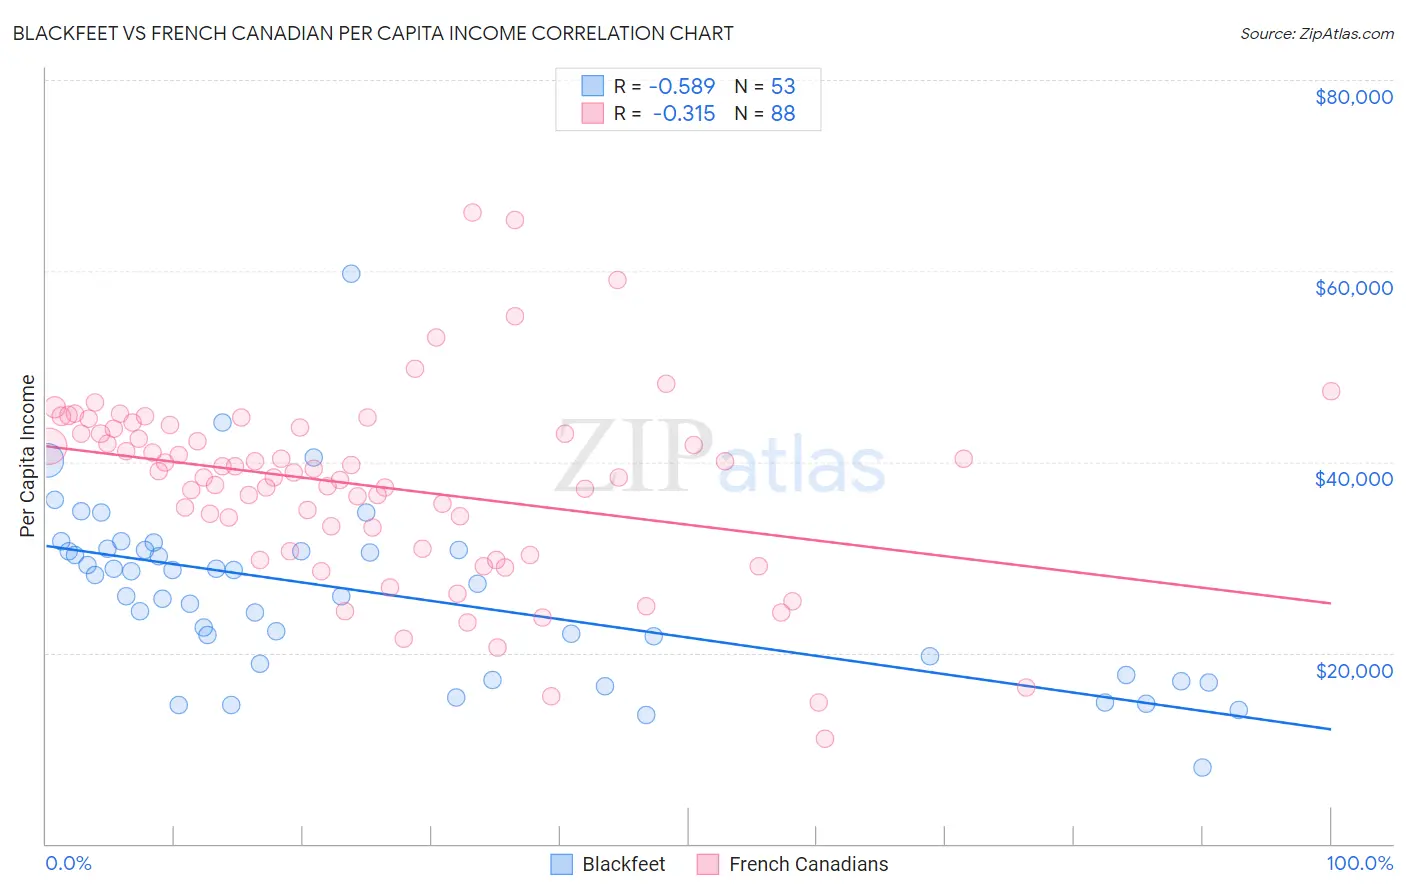
Blackfeet vs French Canadian Per Capita Income Correlation Chart
The statistical analysis conducted on geographies consisting of 309,586,612 people shows a substantial negative correlation between the proportion of Blackfeet and per capita income in the United States with a correlation coefficient (R) of -0.589 and weighted average of $37,695. Similarly, the statistical analysis conducted on geographies consisting of 502,704,545 people shows a mild negative correlation between the proportion of French Canadians and per capita income in the United States with a correlation coefficient (R) of -0.315 and weighted average of $43,003, a difference of 14.1%.
Per Capita Income Correlation Summary
| Measurement | Blackfeet | French Canadian |
| Minimum | $7,946 | $10,964 |
| Maximum | $59,700 | $66,177 |
| Range | $51,754 | $55,213 |
| Mean | $26,182 | $37,443 |
| Median | $27,256 | $38,631 |
| Interquartile 25% (IQ1) | $18,286 | $30,758 |
| Interquartile 75% (IQ3) | $30,810 | $43,262 |
| Interquartile Range (IQR) | $12,524 | $12,504 |
| Standard Deviation (Sample) | $9,146 | $9,955 |
| Standard Deviation (Population) | $9,059 | $9,898 |
Similar Demographics by Per Capita Income
Demographics Similar to Blackfeet by Per Capita Income
In terms of per capita income, the demographic groups most similar to Blackfeet are Dominican ($37,697, a difference of 0.0%), Central American Indian ($37,699, a difference of 0.010%), Guatemalan ($37,766, a difference of 0.19%), African ($37,785, a difference of 0.24%), and U.S. Virgin Islander ($37,589, a difference of 0.28%).
| Demographics | Rating | Rank | Per Capita Income |
| Immigrants | Dominica | 0.2 /100 | #281 | Tragic $37,952 |
| Immigrants | Laos | 0.1 /100 | #282 | Tragic $37,857 |
| Pennsylvania Germans | 0.1 /100 | #283 | Tragic $37,842 |
| Africans | 0.1 /100 | #284 | Tragic $37,785 |
| Guatemalans | 0.1 /100 | #285 | Tragic $37,766 |
| Central American Indians | 0.1 /100 | #286 | Tragic $37,699 |
| Dominicans | 0.1 /100 | #287 | Tragic $37,697 |
| Blackfeet | 0.1 /100 | #288 | Tragic $37,695 |
| U.S. Virgin Islanders | 0.1 /100 | #289 | Tragic $37,589 |
| Immigrants | Guatemala | 0.1 /100 | #290 | Tragic $37,550 |
| Cajuns | 0.1 /100 | #291 | Tragic $37,527 |
| Immigrants | Micronesia | 0.1 /100 | #292 | Tragic $37,464 |
| Mexican American Indians | 0.1 /100 | #293 | Tragic $37,407 |
| Cubans | 0.1 /100 | #294 | Tragic $37,383 |
| Immigrants | Dominican Republic | 0.1 /100 | #295 | Tragic $37,306 |
Demographics Similar to French Canadians by Per Capita Income
In terms of per capita income, the demographic groups most similar to French Canadians are Immigrants ($43,010, a difference of 0.020%), Spaniard ($43,028, a difference of 0.060%), Immigrants from Colombia ($42,971, a difference of 0.070%), Immigrants from Africa ($42,950, a difference of 0.12%), and German ($43,067, a difference of 0.15%).
| Demographics | Rating | Rank | Per Capita Income |
| Finns | 44.4 /100 | #179 | Average $43,461 |
| Sierra Leoneans | 42.9 /100 | #180 | Average $43,405 |
| Welsh | 38.2 /100 | #181 | Fair $43,233 |
| Immigrants | Vietnam | 38.1 /100 | #182 | Fair $43,229 |
| Germans | 33.9 /100 | #183 | Fair $43,067 |
| Spaniards | 32.9 /100 | #184 | Fair $43,028 |
| Immigrants | Immigrants | 32.5 /100 | #185 | Fair $43,010 |
| French Canadians | 32.3 /100 | #186 | Fair $43,003 |
| Immigrants | Colombia | 31.5 /100 | #187 | Fair $42,971 |
| Immigrants | Africa | 31.0 /100 | #188 | Fair $42,950 |
| Bermudans | 30.1 /100 | #189 | Fair $42,911 |
| Kenyans | 27.7 /100 | #190 | Fair $42,808 |
| Yugoslavians | 27.4 /100 | #191 | Fair $42,792 |
| Iraqis | 26.7 /100 | #192 | Fair $42,760 |
| Immigrants | Sierra Leone | 26.5 /100 | #193 | Fair $42,752 |