Blackfeet vs Immigrants from Haiti Per Capita Income
COMPARE
Blackfeet
Immigrants from Haiti
Per Capita Income
Per Capita Income Comparison
Blackfeet
Immigrants from Haiti
$37,695
PER CAPITA INCOME
0.1/ 100
METRIC RATING
288th/ 347
METRIC RANK
$36,849
PER CAPITA INCOME
0.0/ 100
METRIC RATING
306th/ 347
METRIC RANK
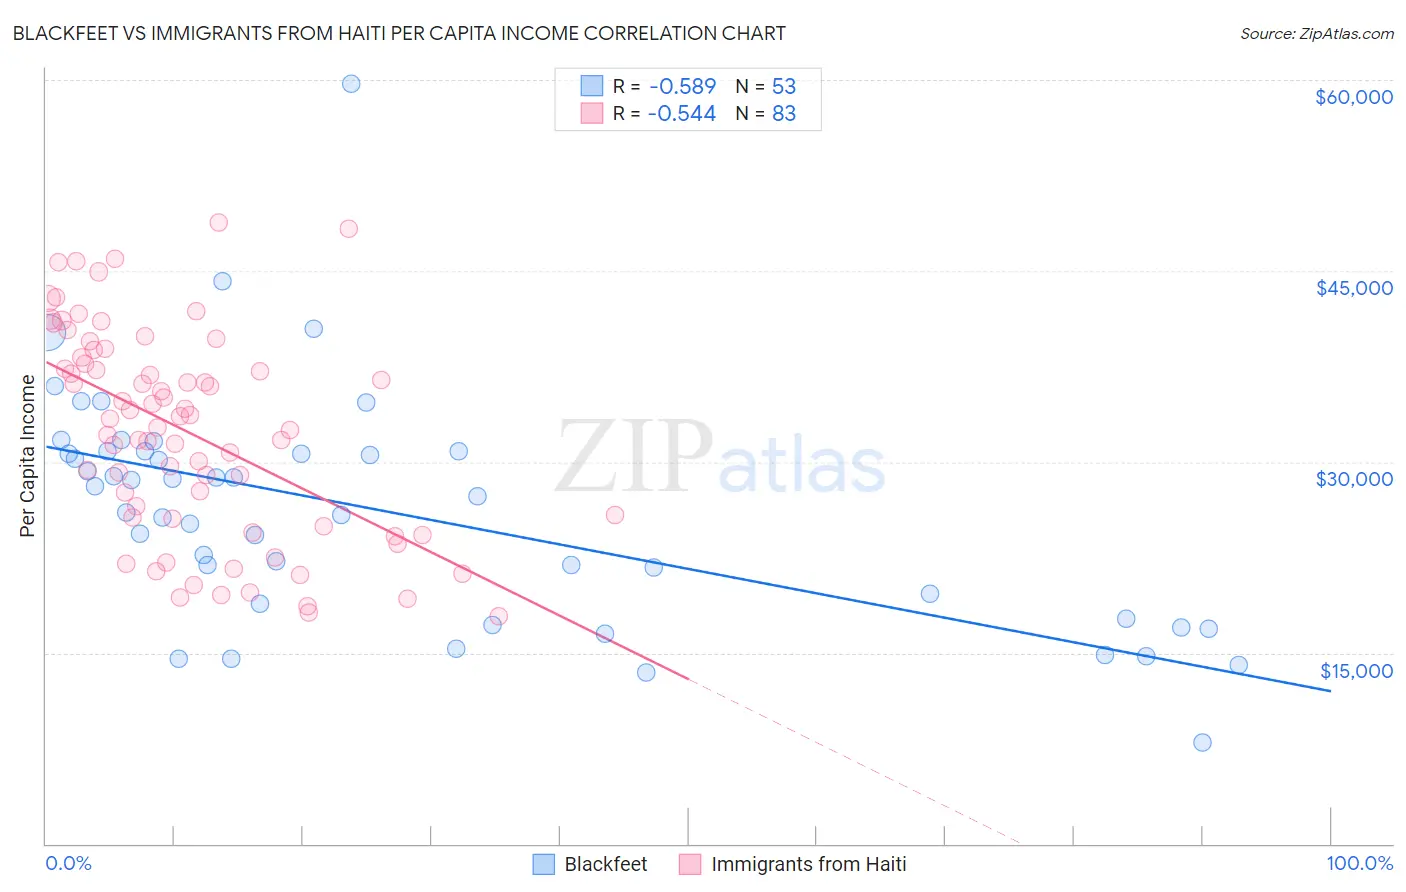
Blackfeet vs Immigrants from Haiti Per Capita Income Correlation Chart
The statistical analysis conducted on geographies consisting of 309,586,612 people shows a substantial negative correlation between the proportion of Blackfeet and per capita income in the United States with a correlation coefficient (R) of -0.589 and weighted average of $37,695. Similarly, the statistical analysis conducted on geographies consisting of 225,290,875 people shows a substantial negative correlation between the proportion of Immigrants from Haiti and per capita income in the United States with a correlation coefficient (R) of -0.544 and weighted average of $36,849, a difference of 2.3%.
Per Capita Income Correlation Summary
| Measurement | Blackfeet | Immigrants from Haiti |
| Minimum | $7,946 | $17,858 |
| Maximum | $59,700 | $48,799 |
| Range | $51,754 | $30,941 |
| Mean | $26,182 | $32,340 |
| Median | $27,256 | $33,392 |
| Interquartile 25% (IQ1) | $18,286 | $25,569 |
| Interquartile 75% (IQ3) | $30,810 | $38,157 |
| Interquartile Range (IQR) | $12,524 | $12,588 |
| Standard Deviation (Sample) | $9,146 | $8,072 |
| Standard Deviation (Population) | $9,059 | $8,023 |
Demographics Similar to Blackfeet and Immigrants from Haiti by Per Capita Income
In terms of per capita income, the demographic groups most similar to Blackfeet are Dominican ($37,697, a difference of 0.0%), U.S. Virgin Islander ($37,589, a difference of 0.28%), Immigrants from Guatemala ($37,550, a difference of 0.39%), Cajun ($37,527, a difference of 0.45%), and Immigrants from Micronesia ($37,464, a difference of 0.62%). Similarly, the demographic groups most similar to Immigrants from Haiti are Immigrants from Latin America ($36,823, a difference of 0.070%), Inupiat ($36,999, a difference of 0.41%), Honduran ($37,031, a difference of 0.49%), Paiute ($37,066, a difference of 0.59%), and Shoshone ($37,072, a difference of 0.61%).
| Demographics | Rating | Rank | Per Capita Income |
| Dominicans | 0.1 /100 | #287 | Tragic $37,697 |
| Blackfeet | 0.1 /100 | #288 | Tragic $37,695 |
| U.S. Virgin Islanders | 0.1 /100 | #289 | Tragic $37,589 |
| Immigrants | Guatemala | 0.1 /100 | #290 | Tragic $37,550 |
| Cajuns | 0.1 /100 | #291 | Tragic $37,527 |
| Immigrants | Micronesia | 0.1 /100 | #292 | Tragic $37,464 |
| Mexican American Indians | 0.1 /100 | #293 | Tragic $37,407 |
| Cubans | 0.1 /100 | #294 | Tragic $37,383 |
| Immigrants | Dominican Republic | 0.1 /100 | #295 | Tragic $37,306 |
| Indonesians | 0.1 /100 | #296 | Tragic $37,300 |
| Haitians | 0.1 /100 | #297 | Tragic $37,289 |
| Immigrants | Caribbean | 0.1 /100 | #298 | Tragic $37,254 |
| Cherokee | 0.1 /100 | #299 | Tragic $37,203 |
| Immigrants | Bahamas | 0.1 /100 | #300 | Tragic $37,193 |
| Ottawa | 0.1 /100 | #301 | Tragic $37,101 |
| Shoshone | 0.1 /100 | #302 | Tragic $37,072 |
| Paiute | 0.1 /100 | #303 | Tragic $37,066 |
| Hondurans | 0.1 /100 | #304 | Tragic $37,031 |
| Inupiat | 0.1 /100 | #305 | Tragic $36,999 |
| Immigrants | Haiti | 0.0 /100 | #306 | Tragic $36,849 |
| Immigrants | Latin America | 0.0 /100 | #307 | Tragic $36,823 |