Blackfeet vs Immigrants from Chile Per Capita Income

COMPARE

Blackfeet
Race
Ancestry
AfghanAfricanAlaska NativeAlaskan AthabascanAlbanianAleutAlsatianAmericanApacheArabArapahoArgentineanArmenianAssyrian/Chaldean/SyriacAustralianAustrianBahamianBangladeshiBarbadianBasqueBelgianBelizeanBermudanBhutaneseBlackfeetBolivianBrazilianBritishBritish West IndianBulgarianBurmeseCajunCambodianCanadianCape VerdeanCarpatho RusynCelticCentral AmericanCentral American IndianCherokeeCheyenneChickasawChileanChineseChippewaChoctawColombianColvilleComancheCosta RicanCreeCreekCroatianCrowCubanCypriotCzechCzechoslovakianDanishDelawareDominicanDutchDutch West IndianEastern EuropeanEcuadorianEgyptianEnglishEstonianEthiopianEuropeanFijianFilipinoFinnishFrenchFrench American IndianFrench CanadianGermanGerman RussianGhanaianGreekGuamanian/ChamorroGuatemalanGuyaneseHaitianHmongHonduranHopiHoumaHungarianIcelanderIndian (Asian)IndonesianInupiatIranianIraqiIrishIroquoisIsraeliItalianJamaicanJapaneseJordanianKenyanKiowaKoreanLaotianLatvianLebaneseLiberianLithuanianLumbeeLuxembourgerMacedonianMalaysianMalteseMarshalleseMenomineeMexicanMexican American IndianMongolianMoroccanNative HawaiianNavajoNepaleseNew ZealanderNicaraguanNigerianNorthern EuropeanNorwegianOkinawanOsageOttawaPaiutePakistaniPalestinianPanamanianParaguayanPennsylvania GermanPeruvianPimaPolishPortuguesePotawatomiPuebloPuerto RicanPuget Sound SalishRomanianRussianSalvadoranSamoanScandinavianScotch-IrishScottishSeminoleSenegaleseSerbianShoshoneSierra LeoneanSiouxSlavicSlovakSloveneSomaliSouth AfricanSouth AmericanSouth American IndianSoviet UnionSpaniardSpanishSpanish AmericanSpanish American IndianSri LankanSubsaharan AfricanSudaneseSwedishSwissSyrianTaiwaneseThaiTlingit-HaidaTohono O'OdhamTonganTrinidadian and TobagonianTsimshianTurkishU.S. Virgin IslanderUgandanUkrainianUruguayanUteVenezuelanVietnameseWelshWest IndianYakamaYaquiYugoslavianYumanYup'ikZimbabwean
Immigration
NonimmigrantsImmigrantsAfghanistanAfricaAlbaniaArgentinaArmeniaAsiaAustraliaAustriaBahamasBangladeshBarbadosBelarusBelgiumBelizeBoliviaBosnia and HerzegovinaBrazilBulgariaBurma/MyanmarCabo VerdeCambodiaCameroonCanadaCaribbeanCentral AmericaChinaColombiaCongoCosta RicaCroatiaCubaCzechoslovakiaDenmarkDominicaDominican RepublicEastern AfricaEastern AsiaEastern EuropeEcuadorEgyptEl SalvadorEnglandEritreaEthiopiaEuropeFijiFranceGermanyGhanaGreeceGrenadaGuatemalaGuyanaHaitiHondurasHong KongHungaryIndiaIndonesiaIranIraqIrelandIsraelItalyJamaicaJapanJordanKazakhstanKenyaKoreaKuwaitLaosLatin AmericaLatviaLebanonLiberiaLithuaniaMalaysiaMexicoMicronesiaMiddle AfricaMoldovaMoroccoNepalNetherlandsNicaraguaNigeriaNorth AmericaNorth MacedoniaNorthern AfricaNorthern EuropeNorwayOceaniaPakistanPanamaPeruPhilippinesPolandPortugalRomaniaRussiaSaudi ArabiaScotlandSenegalSerbiaSierra LeoneSingaporeSomaliaSouth AfricaSouth AmericaSouth Central AsiaSouth Eastern AsiaSouthern EuropeSpainSri LankaSt. Vincent and the GrenadinesSudanSwedenSwitzerlandSyriaTaiwanThailandTrinidad and TobagoTurkeyUgandaUkraineUruguayUzbekistanVenezuelaVietnamWest IndiesWestern AfricaWestern AsiaWestern EuropeYemenZaireZimbabweAzores
Immigrants from Chile
Race
Ancestry
AfghanAfricanAlaska NativeAlaskan AthabascanAlbanianAleutAlsatianAmericanApacheArabArapahoArgentineanArmenianAssyrian/Chaldean/SyriacAustralianAustrianBahamianBangladeshiBarbadianBasqueBelgianBelizeanBermudanBhutaneseBolivianBrazilianBritishBritish West IndianBulgarianBurmeseCajunCambodianCanadianCape VerdeanCarpatho RusynCelticCentral AmericanCentral American IndianCherokeeCheyenneChickasawChileanChineseChippewaChoctawColombianColvilleComancheCosta RicanCreeCreekCroatianCrowCubanCypriotCzechCzechoslovakianDanishDelawareDominicanDutchDutch West IndianEastern EuropeanEcuadorianEgyptianEnglishEstonianEthiopianEuropeanFijianFilipinoFinnishFrenchFrench American IndianFrench CanadianGermanGerman RussianGhanaianGreekGuamanian/ChamorroGuatemalanGuyaneseHaitianHmongHonduranHopiHoumaHungarianIcelanderIndian (Asian)IndonesianInupiatIranianIraqiIrishIroquoisIsraeliItalianJamaicanJapaneseJordanianKenyanKiowaKoreanLaotianLatvianLebaneseLiberianLithuanianLumbeeLuxembourgerMacedonianMalaysianMalteseMarshalleseMenomineeMexicanMexican American IndianMongolianMoroccanNative HawaiianNavajoNepaleseNew ZealanderNicaraguanNigerianNorthern EuropeanNorwegianOkinawanOsageOttawaPaiutePakistaniPalestinianPanamanianParaguayanPennsylvania GermanPeruvianPimaPolishPortuguesePotawatomiPuebloPuerto RicanPuget Sound SalishRomanianRussianSalvadoranSamoanScandinavianScotch-IrishScottishSeminoleSenegaleseSerbianShoshoneSierra LeoneanSiouxSlavicSlovakSloveneSomaliSouth AfricanSouth AmericanSouth American IndianSoviet UnionSpaniardSpanishSpanish AmericanSpanish American IndianSri LankanSubsaharan AfricanSudaneseSwedishSwissSyrianTaiwaneseThaiTlingit-HaidaTohono O'OdhamTonganTrinidadian and TobagonianTsimshianTurkishU.S. Virgin IslanderUgandanUkrainianUruguayanUteVenezuelanVietnameseWelshWest IndianYakamaYaquiYugoslavianYumanYup'ikZimbabwean
Immigration
NonimmigrantsImmigrantsAfghanistanAfricaAlbaniaArgentinaArmeniaAsiaAustraliaAustriaBahamasBangladeshBarbadosBelarusBelgiumBelizeBoliviaBosnia and HerzegovinaBrazilBulgariaBurma/MyanmarCabo VerdeCambodiaCameroonCanadaCaribbeanCentral AmericaChileChinaColombiaCongoCosta RicaCroatiaCubaCzechoslovakiaDenmarkDominicaDominican RepublicEastern AfricaEastern AsiaEastern EuropeEcuadorEgyptEl SalvadorEnglandEritreaEthiopiaEuropeFijiFranceGermanyGhanaGreeceGrenadaGuatemalaGuyanaHaitiHondurasHong KongHungaryIndiaIndonesiaIranIraqIrelandIsraelItalyJamaicaJapanJordanKazakhstanKenyaKoreaKuwaitLaosLatin AmericaLatviaLebanonLiberiaLithuaniaMalaysiaMexicoMicronesiaMiddle AfricaMoldovaMoroccoNepalNetherlandsNicaraguaNigeriaNorth AmericaNorth MacedoniaNorthern AfricaNorthern EuropeNorwayOceaniaPakistanPanamaPeruPhilippinesPolandPortugalRomaniaRussiaSaudi ArabiaScotlandSenegalSerbiaSierra LeoneSingaporeSomaliaSouth AfricaSouth AmericaSouth Central AsiaSouth Eastern AsiaSouthern EuropeSpainSri LankaSt. Vincent and the GrenadinesSudanSwedenSwitzerlandSyriaTaiwanThailandTrinidad and TobagoTurkeyUgandaUkraineUruguayUzbekistanVenezuelaVietnamWest IndiesWestern AfricaWestern AsiaWestern EuropeYemenZaireZimbabweAzores
Per Capita Income
Income
Poverty
Unemployment
Labor Participation
Family Structure
Vehicle Availability
Education Level
Disability

Per Capita Income Comparison

Blackfeet

Immigrants from Chile

Tragic
Exceptional
$37,695
PER CAPITA INCOME
0.1/ 100
METRIC RATING
288th/ 347
METRIC RANK
$46,213
PER CAPITA INCOME
94.6/ 100
METRIC RATING
115th/ 347
METRIC RANK

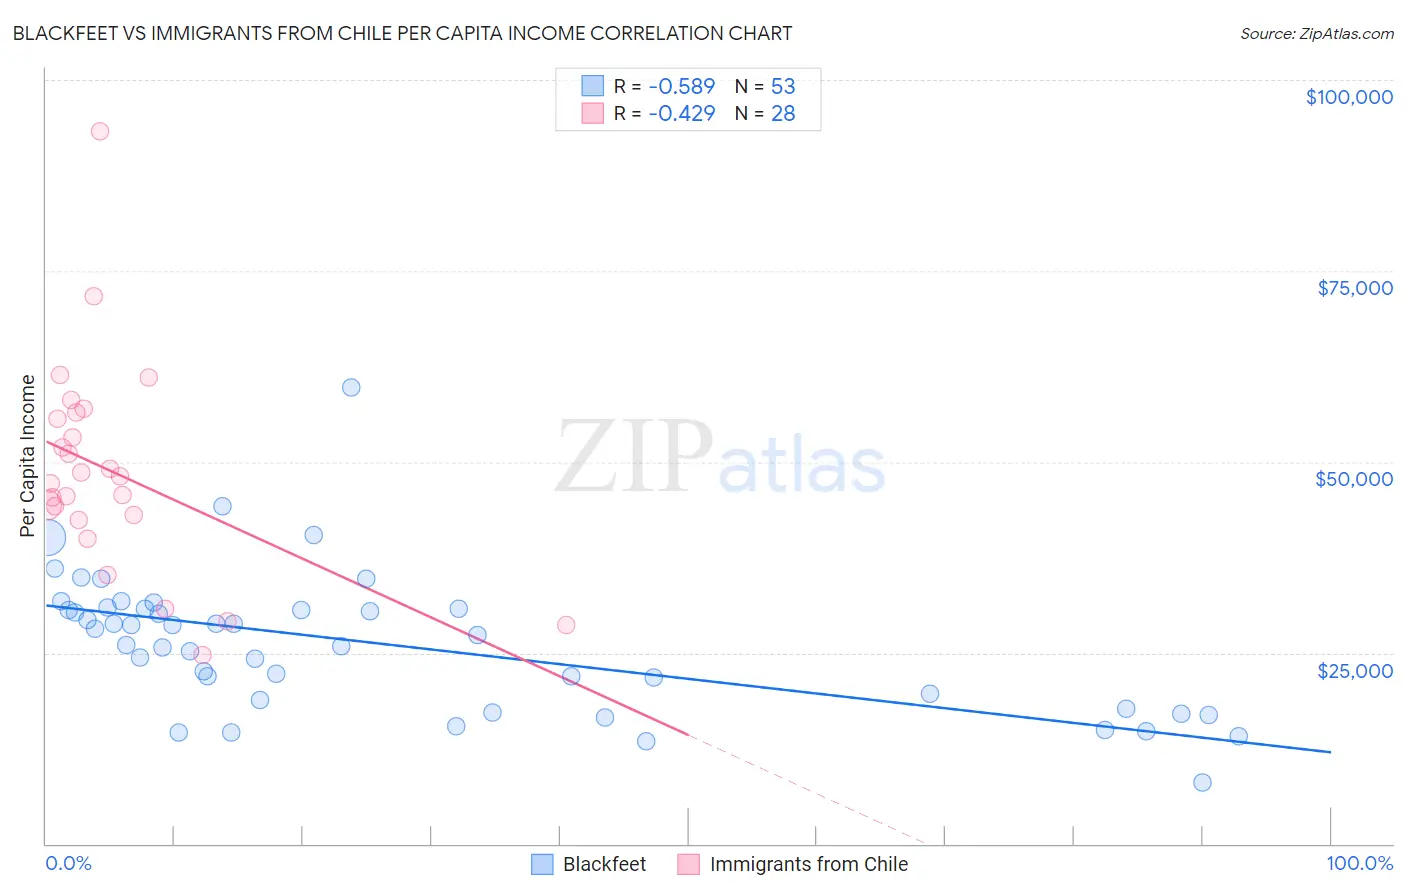
Blackfeet vs Immigrants from Chile Per Capita Income Correlation Chart

The statistical analysis conducted on geographies consisting of 309,586,612 people shows a substantial negative correlation between the proportion of Blackfeet and per capita income in the United States with a correlation coefficient (R) of -0.589 and weighted average of $37,695. Similarly, the statistical analysis conducted on geographies consisting of 218,646,729 people shows a moderate negative correlation between the proportion of Immigrants from Chile and per capita income in the United States with a correlation coefficient (R) of -0.429 and weighted average of $46,213, a difference of 22.6%.
Blackfeet vs Immigrants from Chile Per Capita Income

Per Capita Income Correlation Summary

MeasurementBlackfeetImmigrants from Chile
Minimum$7,946$24,660
Maximum$59,700$93,304
Range$51,754$68,644
Mean$26,182$48,666
Median$27,256$47,656
Interquartile 25% (IQ1)$18,286$42,721
Interquartile 75% (IQ3)$30,810$56,086
Interquartile Range (IQR)$12,524$13,365
Standard Deviation (Sample)$9,146$13,904
Standard Deviation (Population)$9,059$13,654

Similar Demographics by Per Capita Income

Demographics Similar to Blackfeet by Per Capita Income

In terms of per capita income, the demographic groups most similar to Blackfeet are Dominican ($37,697, a difference of 0.0%), Central American Indian ($37,699, a difference of 0.010%), Guatemalan ($37,766, a difference of 0.19%), African ($37,785, a difference of 0.24%), and U.S. Virgin Islander ($37,589, a difference of 0.28%).
DemographicsRating | RankPer Capita Income
Immigrants | Dominica
0.2
/100
|
#281
Tragic
$37,952
Immigrants | Laos
0.1
/100
|
#282
Tragic
$37,857
Pennsylvania Germans
0.1
/100
|
#283
Tragic
$37,842
Africans
0.1
/100
|
#284
Tragic
$37,785
Guatemalans
0.1
/100
|
#285
Tragic
$37,766
Central American Indians
0.1
/100
|
#286
Tragic
$37,699
Dominicans
0.1
/100
|
#287
Tragic
$37,697
Blackfeet
0.1
/100
|
#288
Tragic
$37,695
U.S. Virgin Islanders
0.1
/100
|
#289
Tragic
$37,589
Immigrants | Guatemala
0.1
/100
|
#290
Tragic
$37,550
Cajuns
0.1
/100
|
#291
Tragic
$37,527
Immigrants | Micronesia
0.1
/100
|
#292
Tragic
$37,464
Mexican American Indians
0.1
/100
|
#293
Tragic
$37,407
Cubans
0.1
/100
|
#294
Tragic
$37,383
Immigrants | Dominican Republic
0.1
/100
|
#295
Tragic
$37,306

Demographics Similar to Immigrants from Chile by Per Capita Income

In terms of per capita income, the demographic groups most similar to Immigrants from Chile are Afghan ($46,268, a difference of 0.12%), Polish ($46,123, a difference of 0.20%), Chinese ($46,098, a difference of 0.25%), Immigrants from Albania ($46,387, a difference of 0.38%), and Immigrants from Saudi Arabia ($46,008, a difference of 0.45%).
DemographicsRating | RankPer Capita Income
Immigrants | Kuwait
96.2
/100
|
#108
Exceptional
$46,543
Immigrants | Northern Africa
96.2
/100
|
#109
Exceptional
$46,531
Chileans
95.9
/100
|
#110
Exceptional
$46,459
Taiwanese
95.8
/100
|
#111
Exceptional
$46,455
Immigrants | Morocco
95.7
/100
|
#112
Exceptional
$46,430
Immigrants | Albania
95.5
/100
|
#113
Exceptional
$46,387
Afghans
94.9
/100
|
#114
Exceptional
$46,268
Immigrants | Chile
94.6
/100
|
#115
Exceptional
$46,213
Poles
94.1
/100
|
#116
Exceptional
$46,123
Chinese
93.9
/100
|
#117
Exceptional
$46,098
Immigrants | Saudi Arabia
93.3
/100
|
#118
Exceptional
$46,008
Immigrants | Poland
93.1
/100
|
#119
Exceptional
$45,979
Immigrants | Ethiopia
92.7
/100
|
#120
Exceptional
$45,923
Canadians
92.2
/100
|
#121
Exceptional
$45,858
Moroccans
92.1
/100
|
#122
Exceptional
$45,854