Blackfeet vs Immigrants from St. Vincent and the Grenadines Median Earnings
COMPARE
Blackfeet
Immigrants from St. Vincent and the Grenadines
Median Earnings
Median Earnings Comparison
Blackfeet
Immigrants from St. Vincent and the Grenadines
$41,822
MEDIAN EARNINGS
0.2/ 100
METRIC RATING
284th/ 347
METRIC RANK
$45,908
MEDIAN EARNINGS
32.4/ 100
METRIC RATING
195th/ 347
METRIC RANK
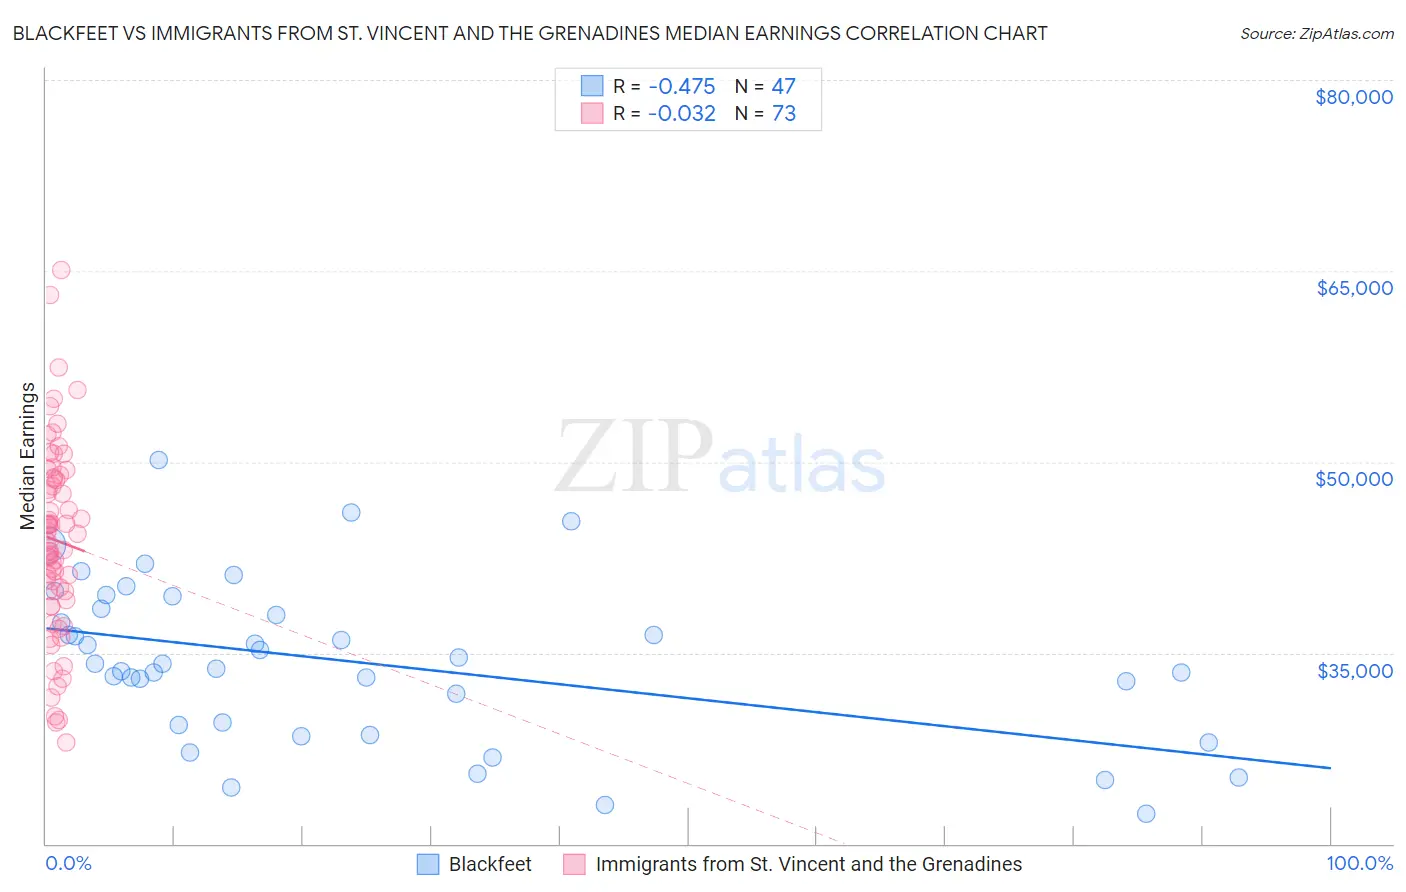
Blackfeet vs Immigrants from St. Vincent and the Grenadines Median Earnings Correlation Chart
The statistical analysis conducted on geographies consisting of 309,547,569 people shows a moderate negative correlation between the proportion of Blackfeet and median earnings in the United States with a correlation coefficient (R) of -0.475 and weighted average of $41,822. Similarly, the statistical analysis conducted on geographies consisting of 56,194,678 people shows no correlation between the proportion of Immigrants from St. Vincent and the Grenadines and median earnings in the United States with a correlation coefficient (R) of -0.032 and weighted average of $45,908, a difference of 9.8%.
Median Earnings Correlation Summary
| Measurement | Blackfeet | Immigrants from St. Vincent and the Grenadines |
| Minimum | $22,344 | $27,951 |
| Maximum | $50,156 | $65,069 |
| Range | $27,812 | $37,118 |
| Mean | $34,283 | $43,851 |
| Median | $34,137 | $43,770 |
| Interquartile 25% (IQ1) | $29,375 | $39,492 |
| Interquartile 75% (IQ3) | $38,433 | $48,733 |
| Interquartile Range (IQR) | $9,058 | $9,241 |
| Standard Deviation (Sample) | $6,292 | $7,478 |
| Standard Deviation (Population) | $6,225 | $7,427 |
Similar Demographics by Median Earnings
Demographics Similar to Blackfeet by Median Earnings
In terms of median earnings, the demographic groups most similar to Blackfeet are Dominican ($41,864, a difference of 0.10%), Immigrants from Nicaragua ($41,737, a difference of 0.20%), Mexican American Indian ($41,719, a difference of 0.25%), Indonesian ($41,701, a difference of 0.29%), and African ($41,955, a difference of 0.32%).
| Demographics | Rating | Rank | Median Earnings |
| Central Americans | 0.3 /100 | #277 | Tragic $42,280 |
| Cajuns | 0.3 /100 | #278 | Tragic $42,189 |
| Colville | 0.2 /100 | #279 | Tragic $42,151 |
| Hmong | 0.2 /100 | #280 | Tragic $42,111 |
| Marshallese | 0.2 /100 | #281 | Tragic $41,969 |
| Africans | 0.2 /100 | #282 | Tragic $41,955 |
| Dominicans | 0.2 /100 | #283 | Tragic $41,864 |
| Blackfeet | 0.2 /100 | #284 | Tragic $41,822 |
| Immigrants | Nicaragua | 0.1 /100 | #285 | Tragic $41,737 |
| Mexican American Indians | 0.1 /100 | #286 | Tragic $41,719 |
| Indonesians | 0.1 /100 | #287 | Tragic $41,701 |
| Immigrants | Dominican Republic | 0.1 /100 | #288 | Tragic $41,554 |
| Comanche | 0.1 /100 | #289 | Tragic $41,519 |
| Paiute | 0.1 /100 | #290 | Tragic $41,508 |
| Central American Indians | 0.1 /100 | #291 | Tragic $41,474 |
Demographics Similar to Immigrants from St. Vincent and the Grenadines by Median Earnings
In terms of median earnings, the demographic groups most similar to Immigrants from St. Vincent and the Grenadines are Immigrants from Costa Rica ($45,928, a difference of 0.040%), German ($45,935, a difference of 0.060%), Guamanian/Chamorro ($45,933, a difference of 0.060%), Finnish ($45,940, a difference of 0.070%), and Yugoslavian ($45,846, a difference of 0.13%).
| Demographics | Rating | Rank | Median Earnings |
| Immigrants | Armenia | 38.3 /100 | #188 | Fair $46,094 |
| Spaniards | 37.2 /100 | #189 | Fair $46,059 |
| French Canadians | 36.1 /100 | #190 | Fair $46,026 |
| Finns | 33.4 /100 | #191 | Fair $45,940 |
| Germans | 33.2 /100 | #192 | Fair $45,935 |
| Guamanians/Chamorros | 33.2 /100 | #193 | Fair $45,933 |
| Immigrants | Costa Rica | 33.0 /100 | #194 | Fair $45,928 |
| Immigrants | St. Vincent and the Grenadines | 32.4 /100 | #195 | Fair $45,908 |
| Yugoslavians | 30.5 /100 | #196 | Fair $45,846 |
| Barbadians | 30.5 /100 | #197 | Fair $45,846 |
| Trinidadians and Tobagonians | 29.7 /100 | #198 | Fair $45,820 |
| Immigrants | Barbados | 29.6 /100 | #199 | Fair $45,816 |
| Immigrants | Azores | 29.5 /100 | #200 | Fair $45,812 |
| Celtics | 27.2 /100 | #201 | Fair $45,732 |
| Immigrants | Trinidad and Tobago | 27.1 /100 | #202 | Fair $45,729 |