Blackfeet vs Immigrants from Hong Kong Median Earnings
COMPARE
Blackfeet
Immigrants from Hong Kong
Median Earnings
Median Earnings Comparison
Blackfeet
Immigrants from Hong Kong
$41,822
MEDIAN EARNINGS
0.2/ 100
METRIC RATING
284th/ 347
METRIC RANK
$59,433
MEDIAN EARNINGS
100.0/ 100
METRIC RATING
4th/ 347
METRIC RANK
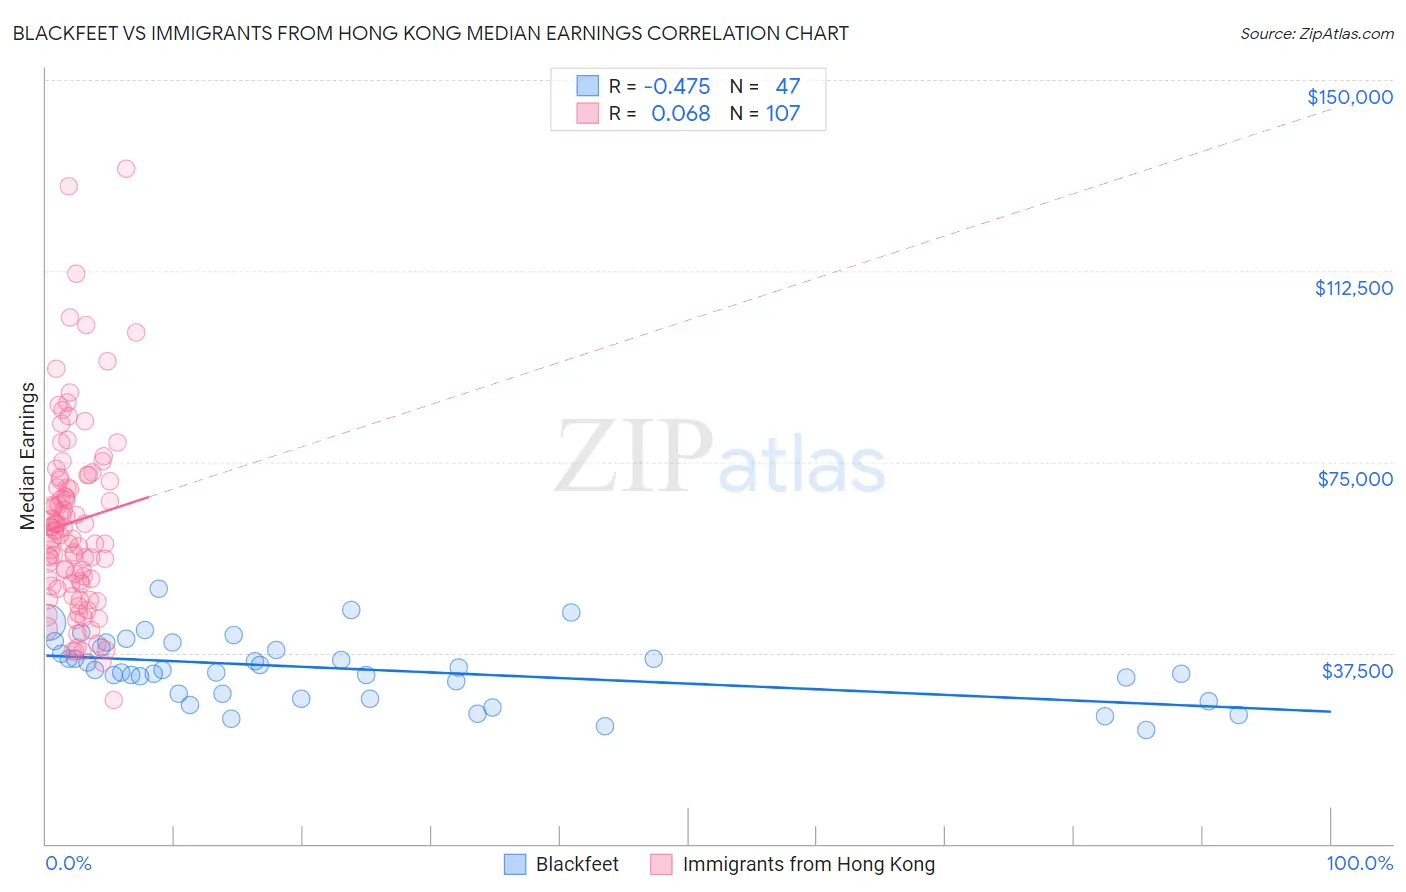
Blackfeet vs Immigrants from Hong Kong Median Earnings Correlation Chart
The statistical analysis conducted on geographies consisting of 309,547,569 people shows a moderate negative correlation between the proportion of Blackfeet and median earnings in the United States with a correlation coefficient (R) of -0.475 and weighted average of $41,822. Similarly, the statistical analysis conducted on geographies consisting of 253,960,155 people shows a slight positive correlation between the proportion of Immigrants from Hong Kong and median earnings in the United States with a correlation coefficient (R) of 0.068 and weighted average of $59,433, a difference of 42.1%.
Median Earnings Correlation Summary
| Measurement | Blackfeet | Immigrants from Hong Kong |
| Minimum | $22,344 | $28,125 |
| Maximum | $50,156 | $132,614 |
| Range | $27,812 | $104,489 |
| Mean | $34,283 | $63,267 |
| Median | $34,137 | $61,404 |
| Interquartile 25% (IQ1) | $29,375 | $51,159 |
| Interquartile 75% (IQ3) | $38,433 | $71,509 |
| Interquartile Range (IQR) | $9,058 | $20,350 |
| Standard Deviation (Sample) | $6,292 | $18,453 |
| Standard Deviation (Population) | $6,225 | $18,367 |
Similar Demographics by Median Earnings
Demographics Similar to Blackfeet by Median Earnings
In terms of median earnings, the demographic groups most similar to Blackfeet are Dominican ($41,864, a difference of 0.10%), Immigrants from Nicaragua ($41,737, a difference of 0.20%), Mexican American Indian ($41,719, a difference of 0.25%), Indonesian ($41,701, a difference of 0.29%), and African ($41,955, a difference of 0.32%).
| Demographics | Rating | Rank | Median Earnings |
| Central Americans | 0.3 /100 | #277 | Tragic $42,280 |
| Cajuns | 0.3 /100 | #278 | Tragic $42,189 |
| Colville | 0.2 /100 | #279 | Tragic $42,151 |
| Hmong | 0.2 /100 | #280 | Tragic $42,111 |
| Marshallese | 0.2 /100 | #281 | Tragic $41,969 |
| Africans | 0.2 /100 | #282 | Tragic $41,955 |
| Dominicans | 0.2 /100 | #283 | Tragic $41,864 |
| Blackfeet | 0.2 /100 | #284 | Tragic $41,822 |
| Immigrants | Nicaragua | 0.1 /100 | #285 | Tragic $41,737 |
| Mexican American Indians | 0.1 /100 | #286 | Tragic $41,719 |
| Indonesians | 0.1 /100 | #287 | Tragic $41,701 |
| Immigrants | Dominican Republic | 0.1 /100 | #288 | Tragic $41,554 |
| Comanche | 0.1 /100 | #289 | Tragic $41,519 |
| Paiute | 0.1 /100 | #290 | Tragic $41,508 |
| Central American Indians | 0.1 /100 | #291 | Tragic $41,474 |
Demographics Similar to Immigrants from Hong Kong by Median Earnings
In terms of median earnings, the demographic groups most similar to Immigrants from Hong Kong are Thai ($59,237, a difference of 0.33%), Immigrants from Singapore ($59,038, a difference of 0.67%), Iranian ($58,474, a difference of 1.6%), Immigrants from India ($60,648, a difference of 2.0%), and Immigrants from Taiwan ($61,151, a difference of 2.9%).
| Demographics | Rating | Rank | Median Earnings |
| Filipinos | 100.0 /100 | #1 | Exceptional $61,197 |
| Immigrants | Taiwan | 100.0 /100 | #2 | Exceptional $61,151 |
| Immigrants | India | 100.0 /100 | #3 | Exceptional $60,648 |
| Immigrants | Hong Kong | 100.0 /100 | #4 | Exceptional $59,433 |
| Thais | 100.0 /100 | #5 | Exceptional $59,237 |
| Immigrants | Singapore | 100.0 /100 | #6 | Exceptional $59,038 |
| Iranians | 100.0 /100 | #7 | Exceptional $58,474 |
| Immigrants | Iran | 100.0 /100 | #8 | Exceptional $57,612 |
| Okinawans | 100.0 /100 | #9 | Exceptional $57,550 |
| Immigrants | South Central Asia | 100.0 /100 | #10 | Exceptional $57,114 |
| Immigrants | Israel | 100.0 /100 | #11 | Exceptional $57,034 |
| Immigrants | Ireland | 100.0 /100 | #12 | Exceptional $56,854 |
| Immigrants | China | 100.0 /100 | #13 | Exceptional $56,638 |
| Immigrants | Australia | 100.0 /100 | #14 | Exceptional $56,305 |
| Indians (Asian) | 100.0 /100 | #15 | Exceptional $56,253 |