Blackfeet vs Inupiat Median Earnings
COMPARE
Blackfeet
Inupiat
Median Earnings
Median Earnings Comparison
Blackfeet
Inupiat
$41,822
MEDIAN EARNINGS
0.2/ 100
METRIC RATING
284th/ 347
METRIC RANK
$43,000
MEDIAN EARNINGS
0.8/ 100
METRIC RATING
263rd/ 347
METRIC RANK
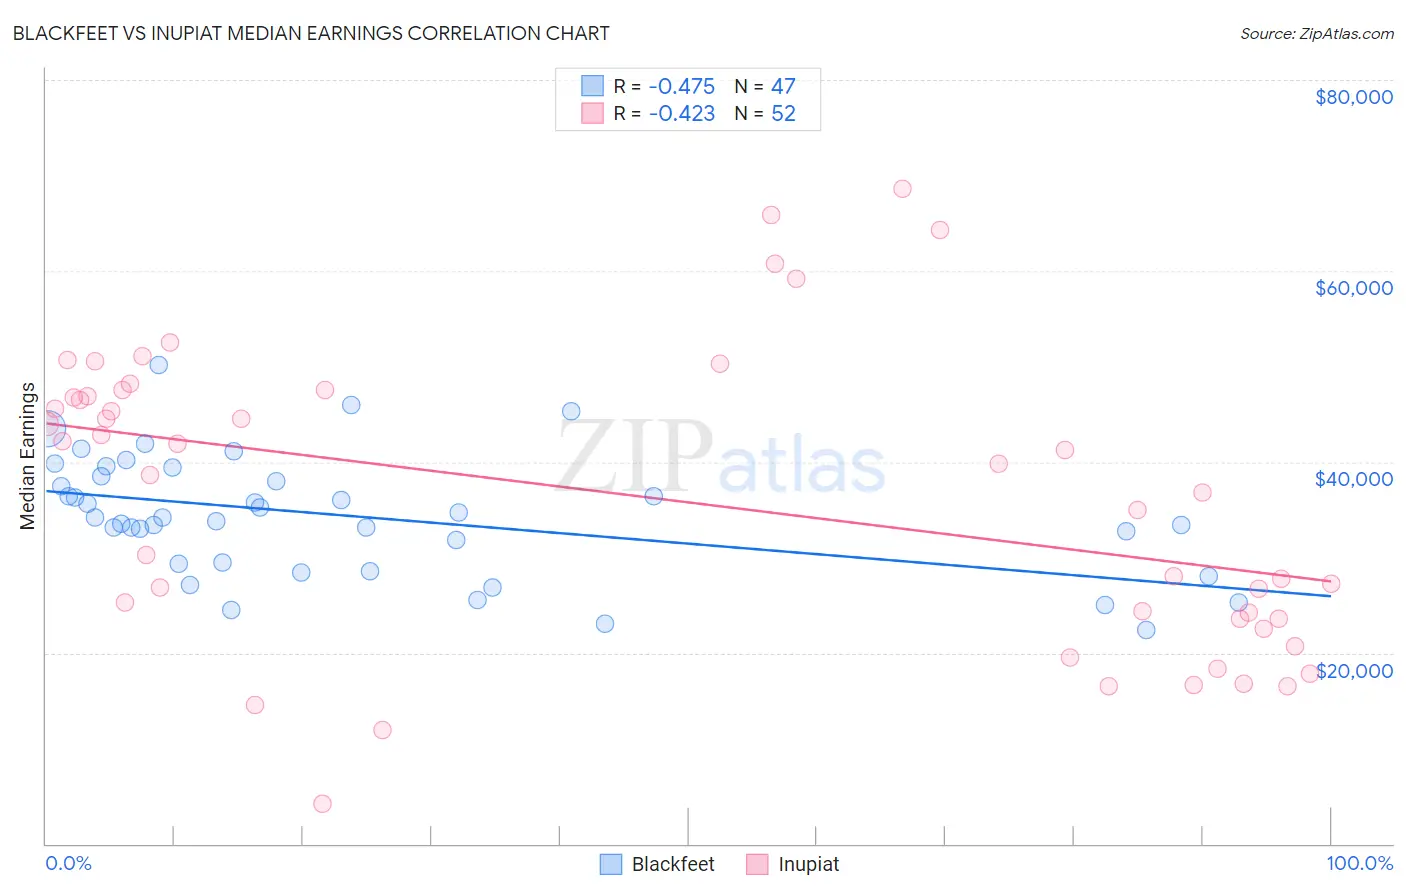
Blackfeet vs Inupiat Median Earnings Correlation Chart
The statistical analysis conducted on geographies consisting of 309,547,569 people shows a moderate negative correlation between the proportion of Blackfeet and median earnings in the United States with a correlation coefficient (R) of -0.475 and weighted average of $41,822. Similarly, the statistical analysis conducted on geographies consisting of 96,339,660 people shows a moderate negative correlation between the proportion of Inupiat and median earnings in the United States with a correlation coefficient (R) of -0.423 and weighted average of $43,000, a difference of 2.8%.
Median Earnings Correlation Summary
| Measurement | Blackfeet | Inupiat |
| Minimum | $22,344 | $4,192 |
| Maximum | $50,156 | $68,590 |
| Range | $27,812 | $64,398 |
| Mean | $34,283 | $36,209 |
| Median | $34,137 | $39,208 |
| Interquartile 25% (IQ1) | $29,375 | $23,611 |
| Interquartile 75% (IQ3) | $38,433 | $47,170 |
| Interquartile Range (IQR) | $9,058 | $23,559 |
| Standard Deviation (Sample) | $6,292 | $15,551 |
| Standard Deviation (Population) | $6,225 | $15,401 |
Similar Demographics by Median Earnings
Demographics Similar to Blackfeet by Median Earnings
In terms of median earnings, the demographic groups most similar to Blackfeet are Dominican ($41,864, a difference of 0.10%), Immigrants from Nicaragua ($41,737, a difference of 0.20%), Mexican American Indian ($41,719, a difference of 0.25%), Indonesian ($41,701, a difference of 0.29%), and African ($41,955, a difference of 0.32%).
| Demographics | Rating | Rank | Median Earnings |
| Central Americans | 0.3 /100 | #277 | Tragic $42,280 |
| Cajuns | 0.3 /100 | #278 | Tragic $42,189 |
| Colville | 0.2 /100 | #279 | Tragic $42,151 |
| Hmong | 0.2 /100 | #280 | Tragic $42,111 |
| Marshallese | 0.2 /100 | #281 | Tragic $41,969 |
| Africans | 0.2 /100 | #282 | Tragic $41,955 |
| Dominicans | 0.2 /100 | #283 | Tragic $41,864 |
| Blackfeet | 0.2 /100 | #284 | Tragic $41,822 |
| Immigrants | Nicaragua | 0.1 /100 | #285 | Tragic $41,737 |
| Mexican American Indians | 0.1 /100 | #286 | Tragic $41,719 |
| Indonesians | 0.1 /100 | #287 | Tragic $41,701 |
| Immigrants | Dominican Republic | 0.1 /100 | #288 | Tragic $41,554 |
| Comanche | 0.1 /100 | #289 | Tragic $41,519 |
| Paiute | 0.1 /100 | #290 | Tragic $41,508 |
| Central American Indians | 0.1 /100 | #291 | Tragic $41,474 |
Demographics Similar to Inupiat by Median Earnings
In terms of median earnings, the demographic groups most similar to Inupiat are Immigrants from Jamaica ($43,026, a difference of 0.060%), Nicaraguan ($43,026, a difference of 0.060%), Immigrants from Liberia ($42,923, a difference of 0.18%), Salvadoran ($42,912, a difference of 0.20%), and Immigrants from Somalia ($43,100, a difference of 0.23%).
| Demographics | Rating | Rank | Median Earnings |
| Alaskan Athabascans | 1.4 /100 | #256 | Tragic $43,393 |
| Jamaicans | 1.3 /100 | #257 | Tragic $43,343 |
| French American Indians | 1.3 /100 | #258 | Tragic $43,333 |
| German Russians | 1.1 /100 | #259 | Tragic $43,200 |
| Immigrants | Somalia | 0.9 /100 | #260 | Tragic $43,100 |
| Immigrants | Jamaica | 0.8 /100 | #261 | Tragic $43,026 |
| Nicaraguans | 0.8 /100 | #262 | Tragic $43,026 |
| Inupiat | 0.8 /100 | #263 | Tragic $43,000 |
| Immigrants | Liberia | 0.7 /100 | #264 | Tragic $42,923 |
| Salvadorans | 0.7 /100 | #265 | Tragic $42,912 |
| Immigrants | Laos | 0.7 /100 | #266 | Tragic $42,884 |
| Cree | 0.6 /100 | #267 | Tragic $42,777 |
| Americans | 0.6 /100 | #268 | Tragic $42,742 |
| Belizeans | 0.5 /100 | #269 | Tragic $42,702 |
| Osage | 0.5 /100 | #270 | Tragic $42,651 |