Blackfeet vs Haitian Median Earnings
COMPARE
Blackfeet
Haitian
Median Earnings
Median Earnings Comparison
Blackfeet
Haitians
$41,822
MEDIAN EARNINGS
0.2/ 100
METRIC RATING
284th/ 347
METRIC RANK
$40,918
MEDIAN EARNINGS
0.0/ 100
METRIC RATING
303rd/ 347
METRIC RANK
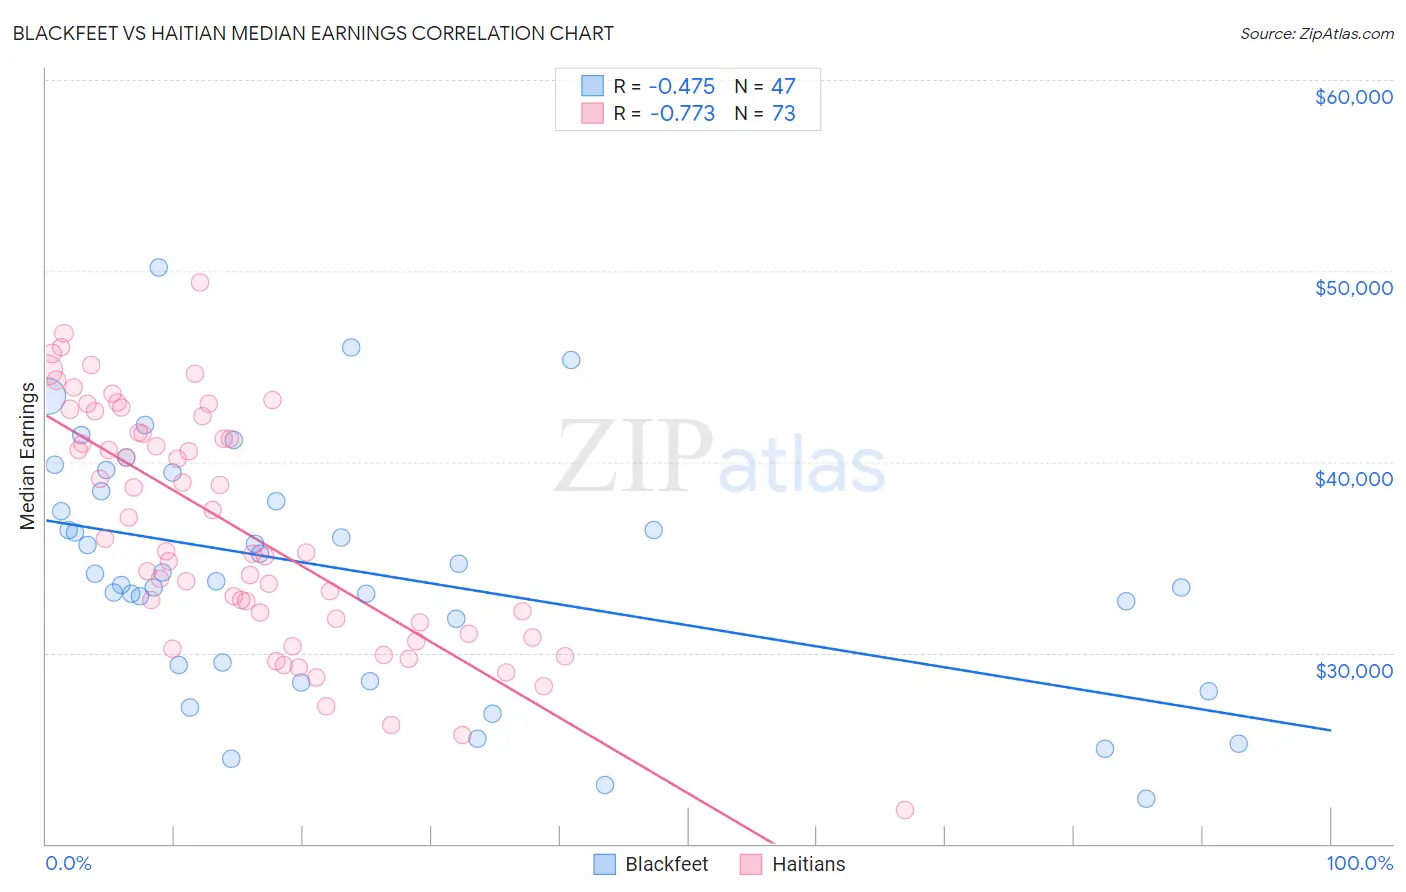
Blackfeet vs Haitian Median Earnings Correlation Chart
The statistical analysis conducted on geographies consisting of 309,547,569 people shows a moderate negative correlation between the proportion of Blackfeet and median earnings in the United States with a correlation coefficient (R) of -0.475 and weighted average of $41,822. Similarly, the statistical analysis conducted on geographies consisting of 288,009,020 people shows a strong negative correlation between the proportion of Haitians and median earnings in the United States with a correlation coefficient (R) of -0.773 and weighted average of $40,918, a difference of 2.2%.
Median Earnings Correlation Summary
| Measurement | Blackfeet | Haitian |
| Minimum | $22,344 | $21,741 |
| Maximum | $50,156 | $49,370 |
| Range | $27,812 | $27,629 |
| Mean | $34,283 | $36,539 |
| Median | $34,137 | $35,319 |
| Interquartile 25% (IQ1) | $29,375 | $31,314 |
| Interquartile 75% (IQ3) | $38,433 | $41,959 |
| Interquartile Range (IQR) | $9,058 | $10,645 |
| Standard Deviation (Sample) | $6,292 | $6,179 |
| Standard Deviation (Population) | $6,225 | $6,136 |
Demographics Similar to Blackfeet and Haitians by Median Earnings
In terms of median earnings, the demographic groups most similar to Blackfeet are Dominican ($41,864, a difference of 0.10%), Immigrants from Nicaragua ($41,737, a difference of 0.20%), Mexican American Indian ($41,719, a difference of 0.25%), Indonesian ($41,701, a difference of 0.29%), and Immigrants from Dominican Republic ($41,554, a difference of 0.64%). Similarly, the demographic groups most similar to Haitians are Shoshone ($40,932, a difference of 0.030%), Ute ($41,051, a difference of 0.32%), Immigrants from Latin America ($41,049, a difference of 0.32%), Immigrants from Caribbean ($41,119, a difference of 0.49%), and Immigrants from Micronesia ($41,133, a difference of 0.52%).
| Demographics | Rating | Rank | Median Earnings |
| Dominicans | 0.2 /100 | #283 | Tragic $41,864 |
| Blackfeet | 0.2 /100 | #284 | Tragic $41,822 |
| Immigrants | Nicaragua | 0.1 /100 | #285 | Tragic $41,737 |
| Mexican American Indians | 0.1 /100 | #286 | Tragic $41,719 |
| Indonesians | 0.1 /100 | #287 | Tragic $41,701 |
| Immigrants | Dominican Republic | 0.1 /100 | #288 | Tragic $41,554 |
| Comanche | 0.1 /100 | #289 | Tragic $41,519 |
| Paiute | 0.1 /100 | #290 | Tragic $41,508 |
| Central American Indians | 0.1 /100 | #291 | Tragic $41,474 |
| U.S. Virgin Islanders | 0.1 /100 | #292 | Tragic $41,448 |
| Immigrants | Zaire | 0.1 /100 | #293 | Tragic $41,325 |
| Potawatomi | 0.1 /100 | #294 | Tragic $41,288 |
| Bangladeshis | 0.1 /100 | #295 | Tragic $41,263 |
| Cherokee | 0.1 /100 | #296 | Tragic $41,252 |
| Guatemalans | 0.1 /100 | #297 | Tragic $41,205 |
| Immigrants | Micronesia | 0.1 /100 | #298 | Tragic $41,133 |
| Immigrants | Caribbean | 0.1 /100 | #299 | Tragic $41,119 |
| Ute | 0.1 /100 | #300 | Tragic $41,051 |
| Immigrants | Latin America | 0.1 /100 | #301 | Tragic $41,049 |
| Shoshone | 0.0 /100 | #302 | Tragic $40,932 |
| Haitians | 0.0 /100 | #303 | Tragic $40,918 |