Bahamian vs Immigrants from South Central Asia Per Capita Income
COMPARE
Bahamian
Immigrants from South Central Asia
Per Capita Income
Per Capita Income Comparison
Bahamians
Immigrants from South Central Asia
$36,427
PER CAPITA INCOME
0.0/ 100
METRIC RATING
313th/ 347
METRIC RANK
$52,660
PER CAPITA INCOME
100.0/ 100
METRIC RATING
27th/ 347
METRIC RANK
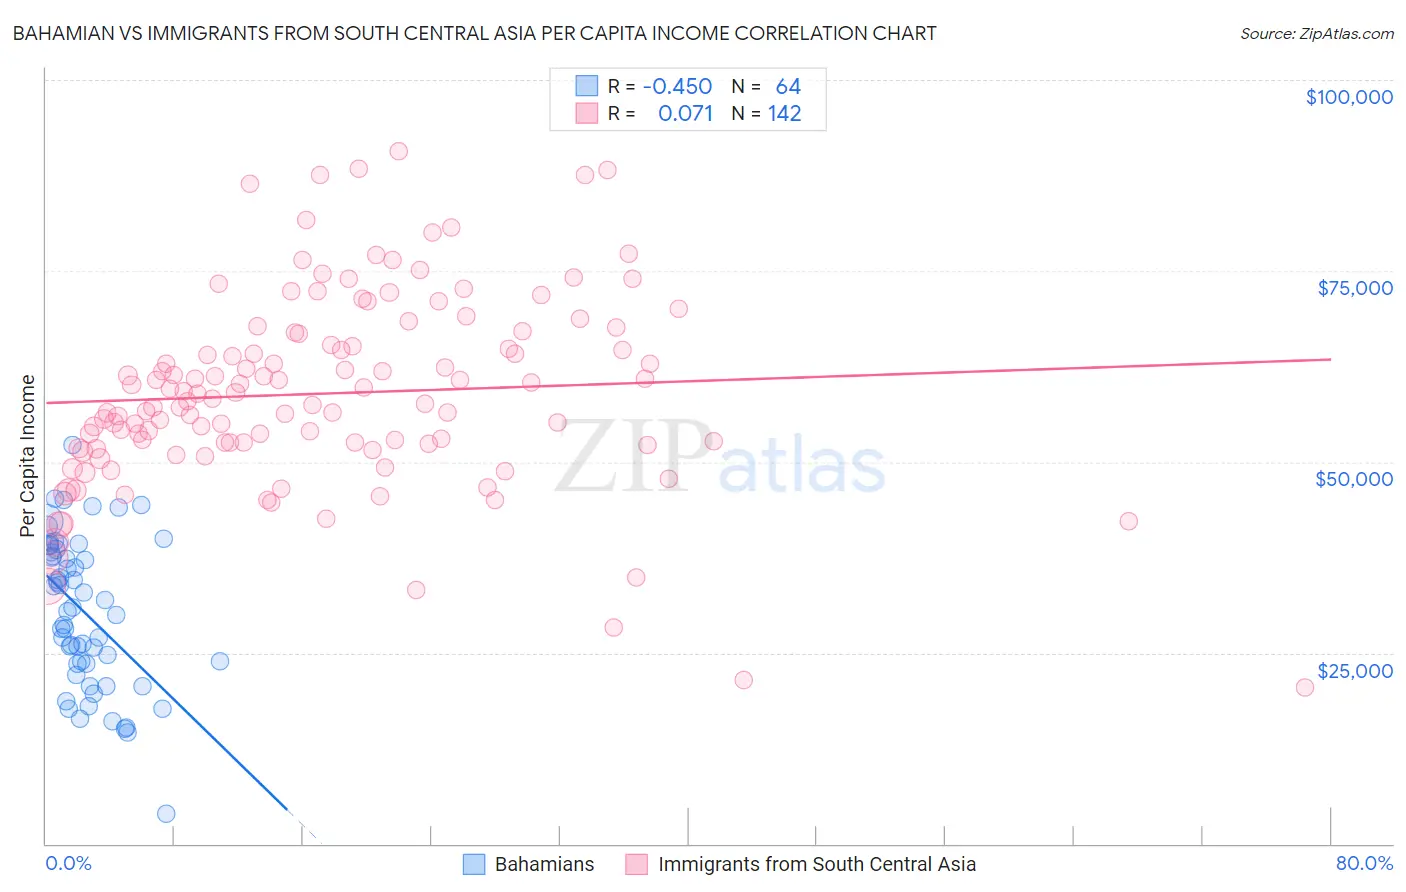
Bahamian vs Immigrants from South Central Asia Per Capita Income Correlation Chart
The statistical analysis conducted on geographies consisting of 112,707,980 people shows a moderate negative correlation between the proportion of Bahamians and per capita income in the United States with a correlation coefficient (R) of -0.450 and weighted average of $36,427. Similarly, the statistical analysis conducted on geographies consisting of 473,150,606 people shows a slight positive correlation between the proportion of Immigrants from South Central Asia and per capita income in the United States with a correlation coefficient (R) of 0.071 and weighted average of $52,660, a difference of 44.6%.
Per Capita Income Correlation Summary
| Measurement | Bahamian | Immigrants from South Central Asia |
| Minimum | $3,864 | $20,428 |
| Maximum | $52,210 | $90,751 |
| Range | $48,346 | $70,323 |
| Mean | $30,310 | $58,959 |
| Median | $30,639 | $58,134 |
| Interquartile 25% (IQ1) | $23,571 | $52,199 |
| Interquartile 75% (IQ3) | $38,367 | $66,712 |
| Interquartile Range (IQR) | $14,797 | $14,513 |
| Standard Deviation (Sample) | $9,801 | $12,766 |
| Standard Deviation (Population) | $9,724 | $12,721 |
Similar Demographics by Per Capita Income
Demographics Similar to Bahamians by Per Capita Income
In terms of per capita income, the demographic groups most similar to Bahamians are Chickasaw ($36,475, a difference of 0.13%), Chippewa ($36,631, a difference of 0.56%), Ute ($36,651, a difference of 0.62%), Immigrants from Honduras ($36,665, a difference of 0.65%), and Seminole ($36,180, a difference of 0.68%).
| Demographics | Rating | Rank | Per Capita Income |
| Immigrants | Haiti | 0.0 /100 | #306 | Tragic $36,849 |
| Immigrants | Latin America | 0.0 /100 | #307 | Tragic $36,823 |
| Fijians | 0.0 /100 | #308 | Tragic $36,690 |
| Immigrants | Honduras | 0.0 /100 | #309 | Tragic $36,665 |
| Ute | 0.0 /100 | #310 | Tragic $36,651 |
| Chippewa | 0.0 /100 | #311 | Tragic $36,631 |
| Chickasaw | 0.0 /100 | #312 | Tragic $36,475 |
| Bahamians | 0.0 /100 | #313 | Tragic $36,427 |
| Seminole | 0.0 /100 | #314 | Tragic $36,180 |
| Yaqui | 0.0 /100 | #315 | Tragic $36,112 |
| Choctaw | 0.0 /100 | #316 | Tragic $35,999 |
| Dutch West Indians | 0.0 /100 | #317 | Tragic $35,922 |
| Bangladeshis | 0.0 /100 | #318 | Tragic $35,897 |
| Immigrants | Congo | 0.0 /100 | #319 | Tragic $35,720 |
| Hispanics or Latinos | 0.0 /100 | #320 | Tragic $35,688 |
Demographics Similar to Immigrants from South Central Asia by Per Capita Income
In terms of per capita income, the demographic groups most similar to Immigrants from South Central Asia are Latvian ($52,649, a difference of 0.020%), Israeli ($52,596, a difference of 0.12%), Immigrants from Austria ($52,503, a difference of 0.30%), Turkish ($52,391, a difference of 0.51%), and Immigrants from Norway ($52,217, a difference of 0.85%).
| Demographics | Rating | Rank | Per Capita Income |
| Soviet Union | 100.0 /100 | #20 | Exceptional $54,202 |
| Immigrants | Northern Europe | 100.0 /100 | #21 | Exceptional $54,159 |
| Indians (Asian) | 100.0 /100 | #22 | Exceptional $53,874 |
| Immigrants | Eastern Asia | 100.0 /100 | #23 | Exceptional $53,806 |
| Immigrants | Denmark | 100.0 /100 | #24 | Exceptional $53,799 |
| Immigrants | Japan | 100.0 /100 | #25 | Exceptional $53,359 |
| Russians | 100.0 /100 | #26 | Exceptional $53,154 |
| Immigrants | South Central Asia | 100.0 /100 | #27 | Exceptional $52,660 |
| Latvians | 100.0 /100 | #28 | Exceptional $52,649 |
| Israelis | 100.0 /100 | #29 | Exceptional $52,596 |
| Immigrants | Austria | 100.0 /100 | #30 | Exceptional $52,503 |
| Turks | 100.0 /100 | #31 | Exceptional $52,391 |
| Immigrants | Norway | 100.0 /100 | #32 | Exceptional $52,217 |
| Australians | 100.0 /100 | #33 | Exceptional $52,074 |
| Immigrants | Russia | 100.0 /100 | #34 | Exceptional $52,044 |